. 2013 May;93(5):761-9.
doi: 10.1189/jlb.1012534. Epub 2013 Mar 8.

Localized bacterial infection induces systemic activation of neutrophils through Cxcr2 signaling in zebrafish

Affiliations

Localized bacterial infection induces systemic activation of neutrophils through Cxcr2 signaling in zebrafish

Qing Deng et al. J Leukoc Biol. 2013 May.

Abstract

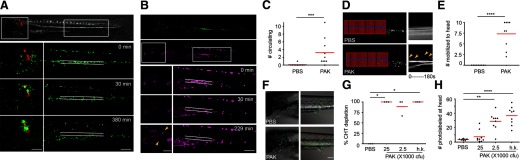
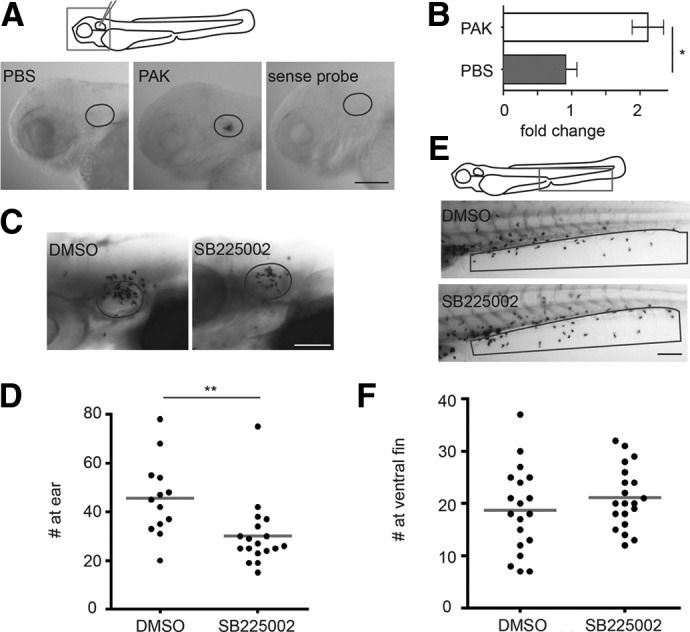
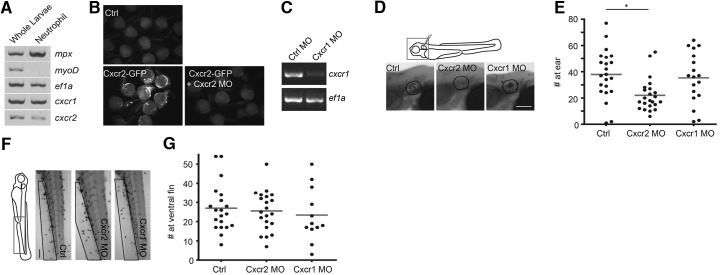
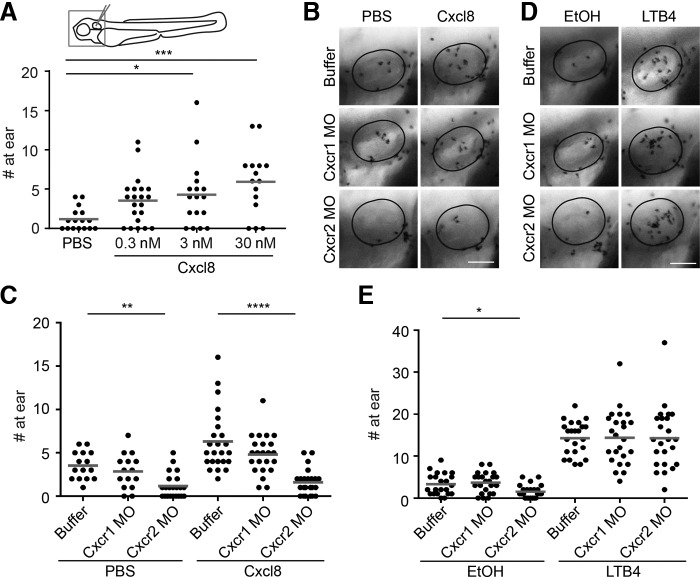
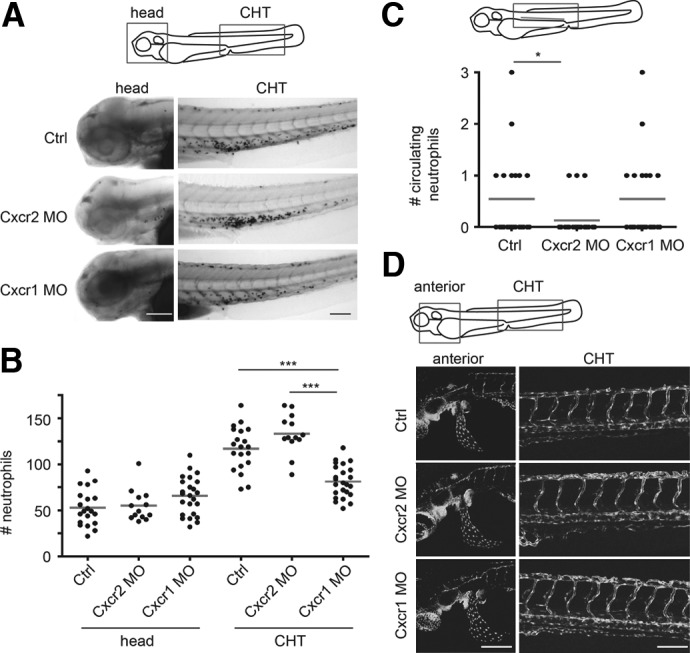
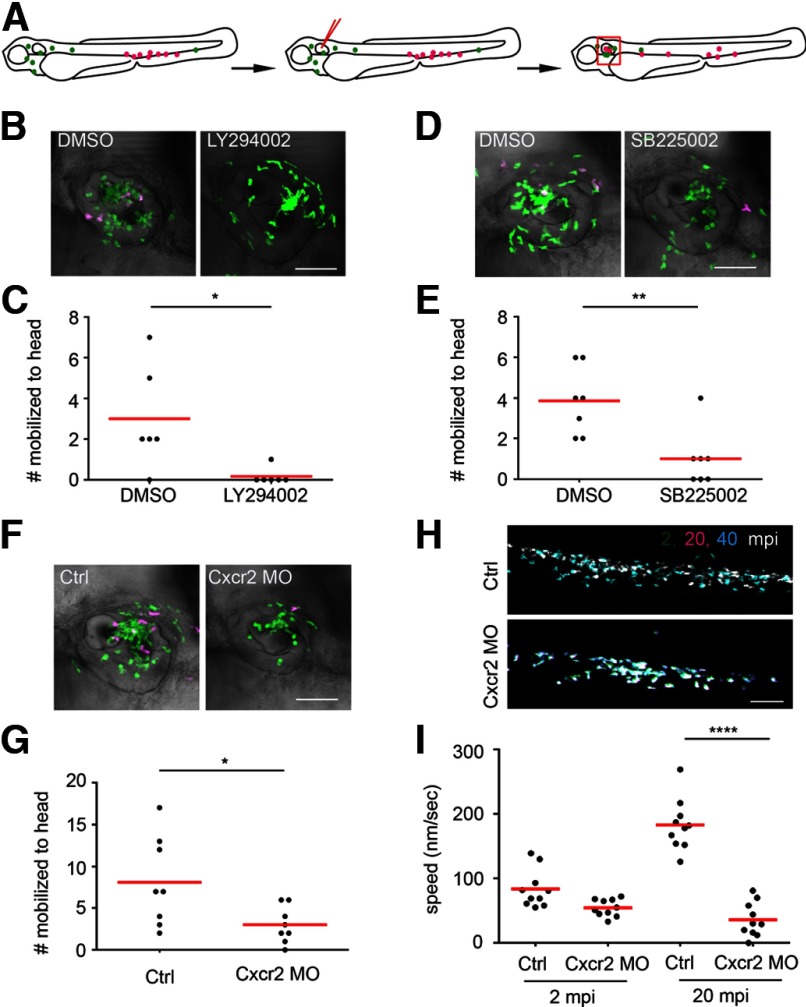
Neutrophils are the first line of defense against tissue damage and are rapidly mobilized to sites of bacterial infection. However, the signals that regulate neutrophil recruitment are not well defined. Here, using photolabel-enabled fate mapping in zebrafish larvae, we show that localized otic infection with Pseudomonas aeruginosa induces systemic activation and mobilization of neutrophils from the CHT through Cxcr2 signaling. We have cloned the zebrafish Cxcr1 and Cxcr2 receptors and show that Cxcr2 functions as a Cxcl8 receptor in live zebrafish. With the use of morpholino-mediated depletion, we show that infection-induced neutrophil mobilization from the CHT is mediated by Cxcr2 but not Cxcr1. By contrast, Cxcr2 depletion does not affect neutrophil recruitment to the chemoattractant LTB4. Taken together, our findings identify Cxcl8-Cxcr2 signaling as an infection-induced long-range cue that mediates neutrophil motility and mobilization from hematopoietic tissues, positioning Cxcr2 as a critical pathway that mediates infection-induced systemic activation of neutrophils.


Figures

Figure 1.
Figure 1.. Localized otic infection with PAK strain induces neutrophil mobilization out of the CHT.
(A) PAK (pMKB1::mCherry) was injected into the otic vesicle of Tg(mpx:dendra2) at 3 dpf. Still images of green neutrophils in the head and CHT (both boxed and enlarged) at indicated time postinfection are shown. Lines indicate the location of the CHT where neutrophils were aggregated. Note the dispersion of neutrophils upon infection. Original scale bars: 100 μm. (B–H) Neutrophils in the CHT were photoconverted to red fluorescence in Tg(mpx:dendra2) at 3 dpf. (B) PAK was injected into the otic vesicle. Still images of photolabeled neutrophils in the head and CHT (both boxed and enlarged) at indicated times postinfection are shown. Lines indicate the location of the CHT where neutrophils were photolabeled originally. Note the dispersion of photolabeled neutrophils in the CHT. Arrowheads indicate some of the photoconverted neutrophils that were mobilized to the head. Original scale bars: 100 μm. (C) Relative numbers of circulating, photolabeled neutrophils by 2 hpi with PAK or PBS. Total numbers of photolabeled neutrophils seen circulating through the posterior cardinal vein in a 3-min movie with 3-s intervals are shown; n = 10 each. ***P < 0.001, two-tailed Mann-Whitney test. (D) Kymography of representative movies used to do quantification in C. Fluorescence signal in boxed regions was stacked vertically into a one-dimensional line at each time-point. The lines were then combined horizontally in time sequence. Kymography of 3-min movies with 3-s intervals is shown. Horizontal lines indicate autofluorescent pigments, which are stationary throughout the movie. Arrowheads indicate the appearance of neutrophils circulating in the posterior cardinal vein. (E) Numbers of photolabeled neutrophils that have reached the head (boxed regions in B) by 2 hpi with PAK or PBS control; n = 9 each. ****P < 0.0001, two-tailed Mann-Whitney test. (F) Representative images of neutrophils in the head and the CHT, 1 dpi with PAK or PBS control. Original scale bar: 100 μm. (G) Percentages of larvae from three separate experiments that were completely depleted of photolabeled neutrophils in the CHT by 1 dpi with PBS, PAK at 25,000, 2500 CFU, or h.k. (bacteria number equivalent to 25,000 CFU). *P < 0.05, Kruskal-Wallis test, followed by Dunn's multiple comparison test. (H) Quantification of photolabeled neutrophils at the head by 1 dpi with PBS, PAK at 25,000, 2500 CFU, or h.k. (bacteria number equivalent to 25,000 CFU); n = 9 each. **P < 0.01; ****P < 0.0001, Kruskal-Wallis test, followed by Dunn's multiple comparison test.
Figure 2.
Figure 2.. Cxcr2 inhibitor SB225002 impairs neutrophil recruitment to PAK otic infection.
(A and B) PBS or PAK was injected into the otic vesicle of 3 dpf WT AB larvae. (A) Larvae were fixed at 1 hpi, and WISH hybridization was performed with Cxcl8 antisense probe. The position of the ear is outlined. PAK-injected larvae were also probed with the Cxcl8 sense probe as a control. Original scale bar: 100 μm. (B) Total RNA was extracted 1 hpi and reverse-transcribed into cDNA. The expression level of Cxcl8 was determined by real-time qPCR. Mean ± sd of three independent experiments was shown. Values were normalized with uninjected siblings. *P < 0.01, two-tailed Mann-Whitney test. (C and D) WT AB zebrafish larvae at 3 dpf were treated with DMSO or 5 μM SB225002 for 1 h, followed by otic infection with PAK. Larvae were kept in SB225002 and fixed 1 hpi, and neutrophils recruited to the ear (outlined regions in C) were quantified; n = 13 and 18, respectively. **P < 0.01, two-tailed Mann-Whitney test. Original scale bar: 100 μm. (E and F) WT AB zebrafish larvae at 3 dpf were treated with DMSO or 5 μM SB225002 for 1 h, followed by bathing in 30 nM LTB4. Larvae were fixed 30 min postaddition of LTB4, and neutrophils recruited to the ventral fin (boxed region in E) were quantified; n = 19 and 20, respectively. Original scale bar: 100 μm.
Figure 3.
Figure 3.. Cloning of zebrafish Cxcr2 receptor.
(A) Cartoon of the arrangement of the Cxcr2 gene. Box, Exon; line, intron; arrow, translation start site (ATG). (B) Alignment of human and zebrafish Cxcr2 proteins. Seven transmembrane domains are indicated with Roman numerals. Note the truncation of zebrafish Cxcr2 protein at the N-terminus. H. sapiens, Homo sapiens. (C) HEK cells were transfected with plasmids coding Dendra2, Cxcr2-Dendra2, or Cxcr1-Dendra2. Cells were stained with DAPI and Phalloidin-Alexa568. Representative confocal images were taken 1 day post-transfection. Original scale bar: 10 μm.
Figure 4.
Figure 4.. Cxcr2, but not Cxcr1, is involved in neutrophil recruitment to PAK otic infection.
(A) Dissociated cells of Tg(mpx:dendra2) at 3 dpf were sorted by FACS to enrich for Dendra2-positive neutrophils. RT-PCR of mpx (neutrophil marker), myoD (muscle cell maker), ef1α (housekeeping), Cxcr1, and Cxcr2 was performed using RNA extracted from whole larvae or sorted neutrophils. (B) Zebrafish Cxcr2-GFP mRNA was injected into zebrafish eggs at one-cell stage alone or in combination with Cxcr2 MO. Representative images of uninjected embryos (Ctrl), injected with Cxcr2-GFP mRNA alone (Cxcr2-GFP) or plus Cxcr2 MO (Cxcr2-GFP+Cxcr2 MO) at 1 dpf indicated efficient suppression of Cxcr2 translation with Cxcr2 MO. (C) WT AB fish were injected with buffer or Cxcr1 MO at one-cell stage. Total RNA was extracted at 3 dpf, and RT-PCR of ef1α and Cxcr1 was performed. (D and E) WT AB fish were injected with buffer, Cxcr2 MO, or Cxcr1 MO at one-cell stage. At 3 dpf, larvae were injected with PAK into the otic vesicle. Neutrophils recruited to the ear (outlined regions in D) at 1 hpi were quantified; n = 22, 23, and 18, respectively. *P < 0.05, Kruskal-Wallis test, followed by Dunn's multiple comparison test. Original scale bar: 100 μm. (F and G) WT AB fish were injected with buffer, Cxcr2 MO, or Cxcr1 MO at one-cell stage. At 3 dpf, larvae were bathed in 30 nM LTB4 for 30 min, and neutrophils recruited to the ventral fin (boxed regions in F) were quantified; n = 20, 21, and 12, respectively. Original scale bar: 100 μm.
Figure 5.
Figure 5.. Cxcr2 depletion specifically impairs neutrophil recruitment to purified zebrafish Cxcl8 but not to LTB4.
(A) WT AB larvae were injected at 3 dpf into the ear cavity with 1 nl PBS control or purified zebrafish Cxcl8 at concentrations of 0.3, 3, and 30 nM. Larvae were fixed 45 min postinjection and stained with Sudan Black. Neutrophils recruited to the ear were quantified. *P < 0.05; ***P < 0.001, Kruskal-Wallis test, followed by Dunn's multiple comparison test. (B and C) Ctrl, Cxcr1, or Cxcr2 morphants were injected at 3 dpf into the ear cavity with 1 nl PBS control or 30 nM zebrafish Cxcl8. Larvae were fixed 45 min postinjection and stained with Sudan Black. Neutrophils recruited to the ear (outlined in B) were quantified; n = 18, 15, 22, 24, 23, and 23, respectively. **P < 0.01; ****P < 0.0001, Kruskal-Wallis test, followed by Dunn's multiple comparison test. Original scale bar: 50 μm. (D and E) Ctrl, Cxcr1, or Cxcr2 morphants were injected at 3 dpf into the ear cavity with 1 nl 0.001% EtOH or 30 nM LTB4 in PBS. Larvae were fixed 45 min postinjection and stained with Sudan Black. Neutrophils recruited to the ear (outlined in D) were quantified; n = 22, 23, 23, 23, 24, and 24, respectively. *P < 0.05, Kruskal-Wallis test, followed by Dunn's multiple comparison test. Original scale bar: 50 μm.
Figure 6.
Figure 6.. Cxcr2 knockdown alters neutrophil homeostasis at steady state.
(A and B) Ctrl, Cxcr2, or Cxcr1 morphants were fixed at 3 dpf and stained with Sudan black, and neutrophil numbers in the head or the CHT were quantified; n = 20, 13, 24, 20, 13, and 24, respectively. ***P < 0.001, Kruskal-Wallis test, followed by Dunn's multiple comparison test. Original scale bars: 100 μm. (C) Quantification of neutrophils circulating through indicated posterior cardinal vein within 3 min in 2 dpf Ctrl, Cxcr2, or Cxcr1 morphants in Tg(mpx:dendra2) background; n = 24 each. *P < 0.05, Kruskal-Wallis test, followed by Dunn's multiple comparison test. (D) Embryos of Tg(fli1a:GFP) were injected with buffer (Ctrl) or Cxcr2 or Cxcr1 MO at one-cell stage. Representative images of the vasculature in the head, yolk sac, and trunk are shown. Original scale bars: 100 μm.
Figure 7.
Figure 7.. Neutrophils from the CHT are recruited to the infected ear via a Cxcr2-dependent pathway.
(A) Illustration of experimental procedures in B–G. Neutrophils in the CHT were photoconverted to red fluorescence in Tg(mpx:dendra2) at 3 dpf. The larvae were then injected with PAK in the ear. Photolabeled neutrophils that were mobilized to the head (as in the boxed region illustrated in Fig. 1A) at 1 hpi were quantified. (B and C) The larvae were treated with DMSO or 32.5 μM LY294002, 1 h prior to and postinfection; n = 6 each. *P = 0.0152, two-tailed Mann-Whitney test. Original scale bar: 50 μm. (D and E) The larvae were treated with DMSO or 5 μM SB225002, 1 h prior to and postinfection; n = 7 each. **P=0.0052, two-tailed Mann-Whitney test. Original scale bar: 50 μm. (F and G) Tg(mpx:dendra2) embryos were injected with buffer (Ctrl) or Cxcr2 MO at one-cell stage and then processed as described in A; n = 8 each. *P = 0.0277, two-tailed Mann-Whitney test. Original scale bar: 50 μm. (H) Tg(mpx:dendra2) embryos were injected with buffer (Ctrl) or Cxcr2 MO at one-cell stage. Larvae were injected at 3 dpf with PAK in the otic vesicle. Neutrophil locations in the CHT at 2 (green), 20 (magenta), and 40 (cyan) min postinfection were overlayed. Neutrophil location remains relatively stationary during the first 20 mpi; however, neutrophils move out of their original location 40 mpi in control fish but not in Cxcr2 morphants. Original scale bar: 100 μm. (I) Neutrophil motility at the CHT, 2 or 20 min postinfection, in control and Cxcr2 morphants was quantified. Results were from 10 individual neutrophils from two independent movies for each condition. ****P < 0.0001, Kruskal-Wallis test, followed by Dunn's multiple comparison test.

References

    1. Furze R. C., Rankin S. M. (2008) Neutrophil mobilization and clearance in the bone marrow. Immunology 125, 281–288 - PMC - PubMed
    1. Christopher M. J., Link D. C. (2007) Regulation of neutrophil homeostasis. Curr. Opin. Hematol. 14, 3–8 - PubMed
    1. Hall C. J., Flores M. V., Oehlers S. H., Sanderson L. E., Lam E. Y., Crosier K. E., Crosier P. S. (2012) Infection-responsive expansion of the hematopoietic stem and progenitor cell compartment in zebrafish is dependent upon inducible nitric oxide. Cell Stem Cell 10, 198–209 - PubMed
    1. Semerad C. L., Liu F., Gregory A. D., Stumpf K., Link D. C. (2002) G-CSF is an essential regulator of neutrophil trafficking from the bone marrow to the blood. Immunity 17, 413–423 - PubMed
    1. Deng Q., Yoo S. K., Cavnar P. J., Green J. M., Huttenlocher A. (2011) Dual roles for Rac2 in neutrophil motility and active retention in zebrafish hematopoietic tissue. Dev. Cell 21, 735–745 - PMC - PubMed

Publication types