. 2013 Jun;11(6):579-92.
doi: 10.1158/1541-7786.MCR-12-0437-T. Epub 2013 Mar 8.

Metabolic alterations in lung cancer-associated fibroblasts correlated with increased glycolytic metabolism of the tumor

Affiliations

Metabolic alterations in lung cancer-associated fibroblasts correlated with increased glycolytic metabolism of the tumor

Virendra K Chaudhri et al. Mol Cancer Res. 2013 Jun.

Abstract

Cancer cells undergo a metabolic reprogramming but little is known about metabolic alterations of other cells within tumors. We use mass spectrometry-based profiling and a metabolic pathway-based systems analysis to compare 21 primary human lung cancer-associated fibroblast lines (CAF) to "normal" fibroblast lines (NF) generated from adjacent nonneoplastic lung tissue. CAFs are protumorigenic, although the mechanisms by which CAFs support tumors have not been elucidated. We have identified several pathways whose metabolite abundance globally distinguished CAFs from NFs, suggesting that metabolic alterations are not limited to cancer cells. In addition, we found metabolic differences between CAFs from high and low glycolytic tumors that might reflect distinct roles of CAFs related to the tumor's glycolytic capacity. One such change was an increase of dipeptides in CAFs. Dipeptides primarily arise from the breakdown of proteins. We found in CAFs an increase in basal macroautophagy which likely accounts for the increase in dipeptides. Furthermore, we show a difference between CAFs and NFs in the induction of autophagy promoted by reduced glucose. In sum, our data suggest that increased autophagy may account for metabolic differences between CAFs and NFs and may play additional as yet undetermined roles in lung cancer.


Figures

Figure 1
Figure 1. Primary non-immortalized human lung CAFs and paired NFs
A. Flow chart of the protocol to create the CAF and NF lines used in the study. B. Dispersed cells from a lung tumor (CEM23) maintained in culture for the times noted. Cells were fixed, permeabilized and stained for vimentin (red) and keratin (green). The arrow notes a cluster of keratin-positive cells at 14 days of culture without passage. Images were collected at 20×. C. Cells from the tumor shown in panel B and corresponding non-neoplastic tissue after repeated passage in culture. Cells were fixed, permeabilized and stained as follows. The same field of cells is shown. In the images on the left, keratin is pseudocolored red, in the middle images vimentin is red and on the right vimentin is red and αSMA green. In all images DNA staining is pseudocolored blue. In the culture conditions used, the vimentin-positive cells proliferate, whereas the keratin-positive cells of the original cultures (from both tumor and non-neoplastic tissue) do not. Therefore only vimentin-positive cells remain after repeated in vitro passages to expand the cultures. In the example shown, the CEM23 CAFs highly expressed αSMA, a marker characteristic of activated fibroblasts, whereas the paired CEM23 NFs did not. Images were collected at 40×. The intensities of the individual colors were identically scaled across all images. D. Cells from two different CAFs and NFs pairs, after multiple passages in vitro, were stained for vimentin (red), αSMA (green) and DNA (blue). Two different fields for each pair of CAFs and NFs are shown. These data illustrate the heterogeneity of αSMA expression among the different CAFs and NFs. In both cases the CAFs express more αSMA than their paired NFs. CEM248 CAFs are fairly homogenous for αSMA expression compared to CEM254. Some of the CEM254 NFs express significant amounts of αSMA, whereas CEM254 NFs have very low levels of αSMA expression. E. The expression of caveolin-1 in 6 different pairs of CAFs and corresponding NFs was determined by Western blotting. The antibody detected a doublet at about 20,000 daltons. The actin blot serves as a control for the amount of extracts loaded per lane. F. Cells from three different CAF and NF pairs, after multiple passages in vitro, were stained for caveolin-1 (green) and DNA (blue). There were no consistent differences in caveolin-1 expression between CAFs and NFs, either in subcellular localization or amount per cell. Images were collected at 40×. The intensities within each fluorescence color are scaled the same across all images.
Figure 2
Figure 2. Steady-state metabolite profiles in CAFs and paired NFs
A. Heat map of the abundances of 203 metabolites in 21 pairs of CAFs and NFs. The abundances of each metabolite are scaled to a median value of 1. The color scale is noted below. The CEM numbers are the cell line identifiers. A list of the 203 metabolites is in Supplemental Table I. The heat map panel is shown in a larger format in Supplemental Figure 1A. B. Distributions of all 203 metabolites in CAFs and NFs. C. The distributions of “relative” t-scores for the 203 metabolites categorized into 7 biochemical groupings (Supplemental Table I). The numbers of metabolites in each group are shown (n). For display purposes the mean t-score of the (203-n) metabolites not in the group being analyzed was subtracted from the t-scores of the metabolites of the group being analyzed. Thus, the t-score distributions of each of the 7 main pathways are compared to their own reference set. In this way, the further the shift from a relative t-score of 0, the greater the difference from the reference set. The two-tailed unpaired p-values Benjamini-Hochberg corrected for multiple testing of the comparisons of the distributions of the t-scores on the metabolites of the 7 groups to the distributions of the t-scores of the rest of the metabolites are shown on the right. D & E. The metabolite subgroups whose t-scores distributions (D) and change of abundance (log2(CAF/NF) (E) are both different from their reference data at a p-value ≤ 0.05 (two-tailed unpaired p-values Benjamini-Hochberg corrected for multiple testing) are shown. The numbers of metabolites in the subgroups (n) are shown. The results for all 46 subgroups are shown in Supplemental Fig. 2.
Figure 3
Figure 3. High tumor SUVmax (SUV ≥8) correlates with decreased disease-free survival
Disease-free survival of 581 NSCLC patients from February 2000 to December 2009 sorted by SUVmax (SUV ≥8: n=231; SUV≤5: n= 350; median follow-up 23 months).
Figure 4
Figure 4. Metabolomic profiling reveals influence of tumor SUVmax on CAFs and NFs
A. Comparison of 11 CAF/NF pairs associated with tumors of SUVmax ≥ 8. The metabolite subgroups whose t-scores distributions (top panel) and change of abundance (log2(CAF/NF) (bottom panel) are both different from their reference data at a p-value ≤ 0.05 (two-tailed unpaired p-values Benjamini-Hochberg corrected for multiple testing) are shown. B. Comparison of 7 CAF/NF pairs associated with tumors of SUVmax ≤ 5. The subgroups whose t-scores distributions (upper panel) and distributions in change of abundance (log2(CAF/NF) (lower panel) are both different from their reference data at a p-value ≤ 0.05 (two-tailed unpaired p-values Benjamini-Hochberg corrected for multiple testing) are shown. The number of metabolites in the subgroups (n) is shown to the left. C. Comparison of 11 CAFs from high SUVmax (≥8) to 7 CAFs from low SUVmax (≤5) tumors. The subgroups whose t-scores distributions (upper panel) and distributions in change of abundance (log2(CAF/NF) (lower panel) are both different from their reference data at a p-value ≤ 0.05 (two-tailed unpaired p-values Benjamini-Hochberg corrected for multiple testing) are shown. The number of metabolites in the subgroups (n) is shown to the left. D. Comparison of 11 NFs from individuals with high SUVmax (≥8) tumors to 7 NFs from individuals with low SUVmax (≤5) tumors. The subgroups whose t-scores distributions (upper panels) and distributions in change of abundance (log2(CAF/NF) (lower panels) are both different from their reference data at a p-value ≤ 0.05 (two-tailed unpaired p-values Benjamini-Hochberg corrected for multiple testing) are shown. The number of metabolites in the subgroups (n) is shown to the left.
Figure 5
Figure 5. Increased LC3II in CAFs relative to paired NFs
A. A representative LC3 western blot of a CAF/NF pair (CEM 217) used for quantification of LC3I and LC3II. Data are from cells in growth medium, reflecting the basal steady state levels of LC3 and from cells treated with 10 μM chloroquine for 3 hrs to inhibit degradation of LC3II. B. The total amount of LC3 (LC3I and LC3II) in each of 8 fibroblasts lines measured by quantitative Western blotting. The values are normalized to total protein (actin). The data are the mean values ± SEM of at least 3 measurements. C. LC3II as a percent of total LC3 (I + II) in NFs and paired CAFs determined by quantifying Western blots like that shown in panel A. The averages for all 11NF/CAF pairs examined, and for 4 NF/CAF pairs associated with low SUVmax tumors and 7 pairs associated with high SUVmax tumors are shown. * p<0.01. D. Autophagosomes imaged by LC3 immunofluorescence. Representative fields of control cells (growth medium) or cells following 3 hrs incubation in DMEM medium with no glucose or glutamine stained with LC3 antibody. Autophagosomes containing LC3II are shown in green. Images were collected with a 40× objective. Intensity differences between cells reflect differences in amounts of LC3 staining. DAPI stained nuclei shown in blue. E. The effect of 3 hrs of incubation in glucose- and glutamine-free medium on the percent of LC3II measured by Western blotting. The data are the average of data from 4 CAF/NF pairs ± SEM. * p< 0.05, paired, one-tailed students t-test.
Figure 6
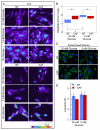
Figure 6. Impact of glucose on autophagy
A. The impact of glucose in the growth media on autophagosomes detected by LC3 fluorescence. Representative images of cells grown in 5 mM, 25 mM glucose or following 3 hr incubation in medium with no glucose and glutamine for 3 hrs are shown. Intensity pseudocolored images are show. The color scale bar is at the bottom of panel A. Images were collected at 40×. B. Quantification of 17 dipeptides by mass spectrometry from cells grown for at least 7 passages in 25 mM or 5 mM glucose. * p < 0.05, paired, two-tailed student t-test. C. Representative epifluorescence images of fluorescent dextran endocytosed from the medium during an 18 hr incubation and then chased into lysosomes by an additional 3-hr incubation in medium without dextran. Cells grown in 25 and 5 mM glucose are shown. The images were collected at 40×. DAPI stained nuclei shown in blue. D. The pH of lysosomes in 7 NF/CAF pairs determined by ratiometric fluorescence microscopy of endocytosed rhodamine-fluorescein (R/F) labeled dextran. The data are the means of the average lysosomal pH of 8 CAF/NF pairs (5 mM glucose) and 2 CAF/NF pairs (25 mM glucose).

References

    1. Albini A, Sporn MB. The tumour microenvironment as a target for chemoprevention. Nature reviews Cancer. 2007;7(2):139–47. Epub 2007/01/16. doi: 10.1038/nrc2067. PubMed PMID: 17218951. - PubMed
    1. Hanahan D, Coussens LM. Accessories to the Crime: Functions of Cells Recruited to the Tumor Microenvironment. Cancer cell. 2012;21(3):309–22. Epub 2012/03/24. doi: 10.1016/j.ccr.2012.02.022. PubMed PMID: 22439926. - PubMed
    1. Cirri P, Chiarugi P. Cancer-associated-fibroblasts and tumour cells: a diabolic liaison driving cancer progression. Cancer metastasis reviews. 2011 Epub 2011/11/22. doi: 10.1007/s10555-011-9340-x. PubMed PMID: 22101652. - PubMed
    1. Ostman A, Augsten M. Cancer-associated fibroblasts and tumor growth--bystanders turning into key players. Current opinion in genetics & development. 2009;19(1):67–73. PubMed PMID: 19211240. - PubMed
    1. Erez N, Truitt M, Olson P, Hanahan D. Cancer-Associated Fibroblasts Are Activated in Incipient Neoplasia to Orchestrate Tumor-Promoting Inflammation in an NF-kappaB-Dependent Manner. Cancer cell. 17(2):135–47. PubMed PMID: 20138012. - PubMed

Publication types