. 2013 Apr;41(8):4481-94.
doi: 10.1093/nar/gkt158. Epub 2013 Mar 9.

HP1a, Su(var)3-9, SETDB1 and POF stimulate or repress gene expression depending on genomic position, gene length and expression pattern in Drosophila melanogaster

Affiliations

HP1a, Su(var)3-9, SETDB1 and POF stimulate or repress gene expression depending on genomic position, gene length and expression pattern in Drosophila melanogaster

Lina E Lundberg et al. Nucleic Acids Res. 2013 Apr.

Abstract

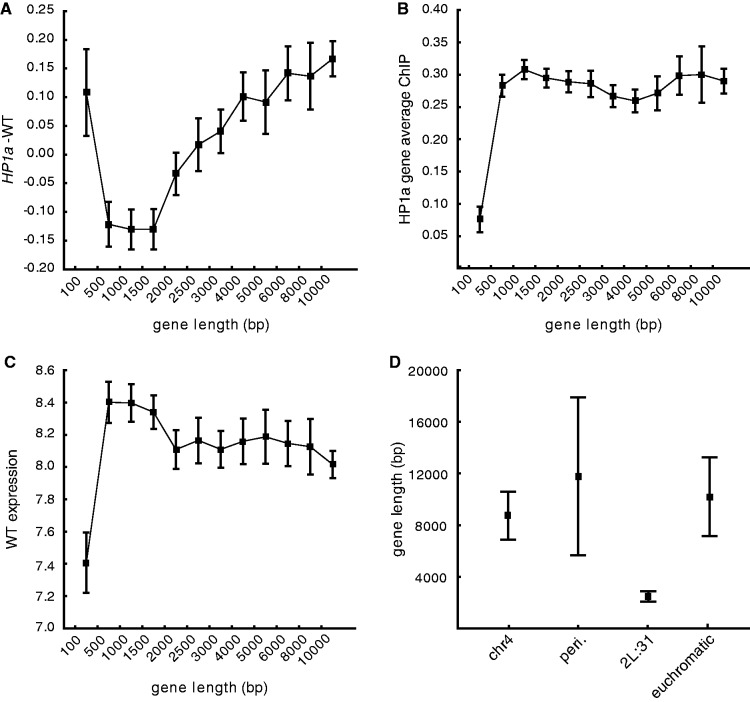
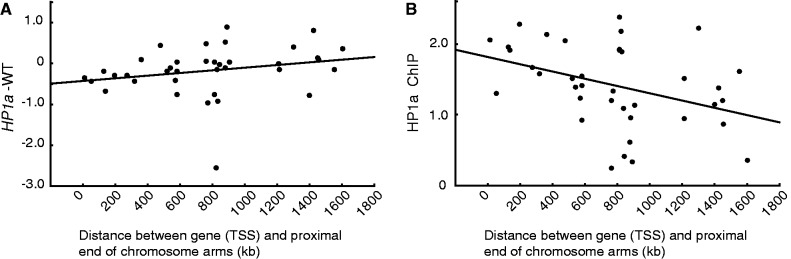
Heterochromatin protein 1a (HP1a) is a chromatin-associated protein important for the formation and maintenance of heterochromatin. In Drosophila, the two histone methyltransferases SETDB1 and Su(var)3-9 mediate H3K9 methylation marks that initiates the establishment and spreading of HP1a-enriched chromatin. Although HP1a is generally regarded as a factor that represses gene transcription, several reports have linked HP1a binding to active genes, and in some cases, it has been shown to stimulate transcriptional activity. To clarify the function of HP1a in transcription regulation and its association with Su(var)3-9, SETDB1 and the chromosome 4-specific protein POF, we conducted genome-wide expression studies and combined the results with available binding data in Drosophila melanogaster. The results suggest that HP1a, SETDB1 and Su(var)3-9 repress genes on chromosome 4, where non-ubiquitously expressed genes are preferentially targeted, and stimulate genes in pericentromeric regions. Further, we showed that on chromosome 4, Su(var)3-9, SETDB1 and HP1a target the same genes. In addition, we found that transposons are repressed by HP1a and Su(var)3-9 and that the binding level and expression effects of HP1a are affected by gene length. Our results indicate that genes have adapted to be properly expressed in their local chromatin environment.


Figures

Figure 1.
Figure 1.
HP1a, SETDB1 and POF binding overlaps on chromosome 4, occasionally POF overlaps with HP1a binding on region 2L:31. (A) HP1a (green) and POF (red) localization on a whole wild-type polytene chromosome. (B) Close-up image of pericentromeric, chromosome 4 and 2L:31 regions. The arrow indicates chromosome 4, arrow head indicates pericentromeric region and asterix indicates cytological region 2L:31. (C) POF and HP1a binding on chromosome 4. (D) POF and HA (for detection of HA-tagged SETDB1) staining in red and green, respectively, on chromosome 4 in a SETDB1-3HA third-instar larva. The arrow indicates chromosome 4 and arrow head indicates pericentromeric region. DNA is stained with DAPI (blue). (E–G) Mean exon binding value (log2 scale) of POF (E), HP1a (F) and Su(var)3-9 (G) for all active genes within chromosome 4, pericentromeric regions, 2L:31 region and control region (whole chromosome 3R) (n =50, 68, 56 and 1753, respectively). Dashed lines represent binding levels in the control region (chromosome 3R) and error bars indicates the 95% confidence interval.
Figure 2.
Figure 2.
HP1 inhibits gene expression on the 4th chromosome and induces gene expression in pericentromeric regions. The mean expression ratio (log2 scale) detected by Affymetrix expression arrays in Pof, HP1a, HP1a Pof, Setdb1 and Su(var)3-9 mutants versus wild-type in (A) chromosome 4, (B) pericentromeric regions, (C) cytological region 2L:31 and (D) control (all active genes, except within the three tested regions). Squares indicate the mean value and whiskers indicate the 95% confidence interval. Dashed lines indicate no change in expression ratio. Wilcoxon matched pairs test was used to estimate the significant difference between the average absolute mutant expression level and average absolute wild-type expression level. ** indicates significant at P < 0.01 and * indicates significant at P < 0.05. (Sample sizes for the Pof mutant were nchr4 = 69, npericentromeric = 79, n2L:31 = 71 and ncontrol = 9131, and for the other mutants, nchr4 = 77, npericentromeric = 82, n2L:31 = 72 and ncontrol = 9356).
Figure 3.
Figure 3.
SETDB1 and Su(var)3-9 display extensive overlapping functions at both genome-wide and chromosome-4 levels. Differentially up- or down-regulated genes from each mutant are compared in a Venn diagram to identify genes that are co-regulated by HP1a, SETDB1 and Su(var)3-9. Genes were defined as differentially up- or down-regulated if none of the three mutant replicates overlapped with any of the three wild-type replicates and if the ratio between mutant and wild-type median values was greater than 0.2 (log2 scale). (A–C) Differentially down-regulated genes (left diagram) or up-regulated genes (right diagram) in the whole genome (A), on chromosome 4 (B) and transposons (C). (D–H) Mean expression ratio (log2 scale) for transposons (n = 32 for Pof mutant and n = 40 for the other mutants) compared with the rest of the genome (n = 9318 for Pof mutant and n = 9547 for the other mutants) in HP1a (D), HP1a Pof (E), Su(var)3-9 (F), Setdb1 (G) and Pof (H) mutants compared with the median of six wild-type replicates (three wild-type replicates for the Pof mutant). Whiskers indicate the 95% confidence interval.
Figure 4.
Figure 4.
HP1a preferentially inhibits NUEGs on chromosome 4 and stimulates expression of UEGs in pericentromeric regions. The mean expression ratio (log2 scale) of NUEG (gray boxes) and UEG (black boxes) genes in Pof, HP1a, HP1a Pof, Setdb1 and Su(var)3-9 mutants in, (A) chromosome 4 (NUEGs: n = 37, UEGs: n = 32 for Pof mutant and NUEGs: n = 45, UEGs: n = 32 for the other mutants), (B) in pericentromeric regions (NUEGs: n = 27, UEGs: n = 52 for Pof mutant and NUEGs: n = 30, UEGs: n = 52 for the other mutants) and (C) in cytological region 2L:31 (NUEGs: n = 19, UEGs: n = 52 for Pof mutant and NUEGs: n = 20, UEGs: n = 52 for the other mutants). Squares indicate the mean value and whiskers indicate the 95% confidence interval. Dashed lines indicate no change in expression ratio. (D–G) Average meta-gene profiles of HP1a binding in NUEG (gray lines) and UEG (black lines) genes on chromosome 4 (D), pericentromeric regions (E), cytological region 2L:31 (F) and chromosome 3R as an HP1a-unbound control region (G). The profiles were compiled based on all active genes in the four regions in a wild-type background and each profile was generated on eight enrichment values on the x-axis. The first point of the curve is an average of the intergenic region upstream of the designated promoter of each gene. The promoter was defined as the 500-bp region upstream of the TSS. The gene body was divided into five bins, and the average enrichment in introns is the last point on the curve. The y-axis shows enrichment on a log2 scale.
Figure 5.
Figure 5.
HP1a inhibits gene expression of long genes and stimulates expression of short genes. (A) Mean plot of expression ratio in an HP1a mutant versus wild-type plotted against bins of gene length (defined as length between transcriptional start and stop sites in kb, sample number is from lowest to highest bins; 473, 1255, 1321, 1189, 897, 662, 930, 592, 425, 565, 348 and 1405, respectively). (B) Mean plot of average HP1a binding values of all genes plotted against bins of gene length. (C) Mean plot of wild-type expression value plotted against bins of gene length. (D) Average gene length (of the active genes that are included in this study) in the different HP1a binding regions: chromosome 4 (n = 78), pericentromeric regions (n = 88), cytological region 2L:31 (n = 72) and in the remaining euchromatic genome (n = 9824). All y-axis values are on a log2 scale and whiskers indicate the 95% confidence interval.
Figure 6.
Figure 6.
Distance of genes from the centromere within pericentromeric regions affects the level of HP1a regulation. (A) Correlation plot between the expression ratios in the HP1a mutant versus wild-type and the distance between transcriptional start site (TSS) and centromere (the end coordinates of the gene arms as defined by FlyBase genome release 5.0) within the pericentromeric regions of chromosome 2L and 3L. (B) HP1a binding levels correlated to the distance between TSS and centromere. For both these plots, genes defined as unbound by HP1a were removed. Both y-axis values are on a log2 scale. The Spearman correlation coefficient was significant for (A) (rs = 0.406, P = 0.013) and (B) (rs = −0.454, P = 0.004).

References

    1. Grewal SI, Elgin SC. Heterochromatin: new possibilities for the inheritance of structure. Curr. Opin. Genet. Dev. 2002;12:178–187. - PubMed
    1. Eissenberg JC, Reuter G. Cellular mechanism for targeting heterochromatin formation in Drosophila. Int. Rev. Cell Mol. Biol. 2009;273:1–47. - PubMed
    1. Filion GJ, van Bemmel JG, Braunschweig U, Talhout W, Kind J, Ward LD, Brugman W, de Castro IJ, Kerkhoven RM, Bussemaker HJ, et al. Systematic protein location mapping reveals five principal chromatin types in Drosophila cells. Cell. 2010;143:212–224. - PMC - PubMed
    1. Richards EJ, Elgin SC. Epigenetic codes for heterochromatin formation and silencing: rounding up the usual suspects. Cell. 2002;108:489–500. - PubMed
    1. Vermaak D, Malik HS. Multiple roles for heterochromatin protein 1 genes in Drosophila. Annu. Rev. Genet. 2009;43:467–492. - PubMed

Publication types

MeSH terms

Substances

Associated data