. 2013 Apr;41(7):e90.
doi: 10.1093/nar/gkt090. Epub 2013 Mar 9.

Low-level processing of Illumina Infinium DNA Methylation BeadArrays

Affiliations

Low-level processing of Illumina Infinium DNA Methylation BeadArrays

Timothy J Triche Jr et al. Nucleic Acids Res. 2013 Apr.

Abstract

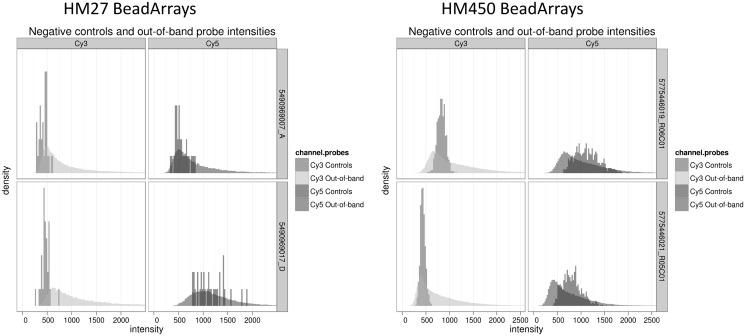
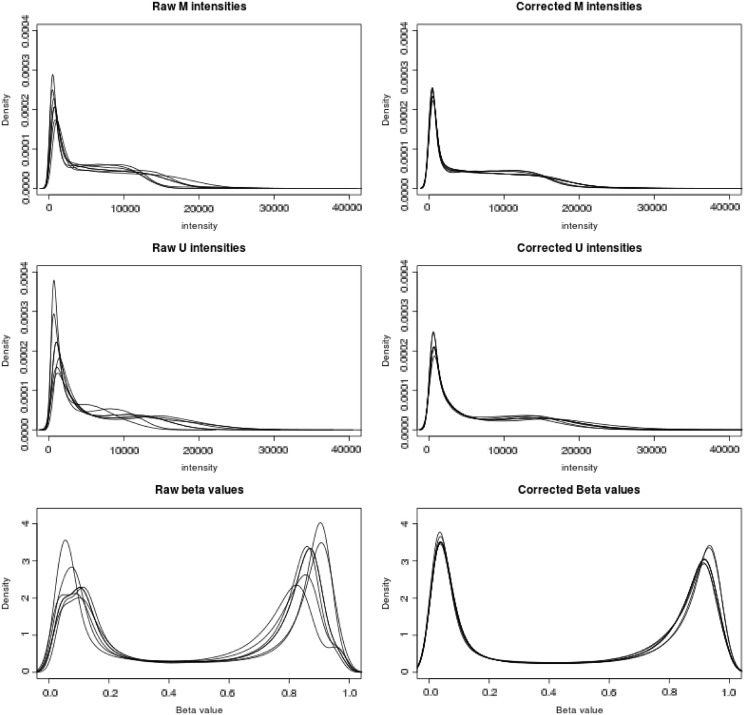
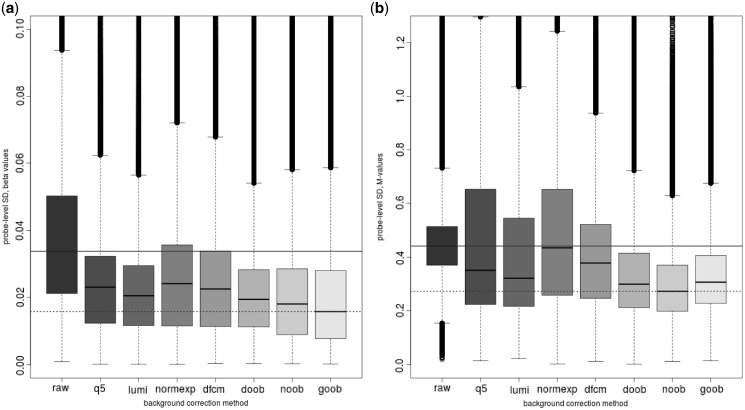
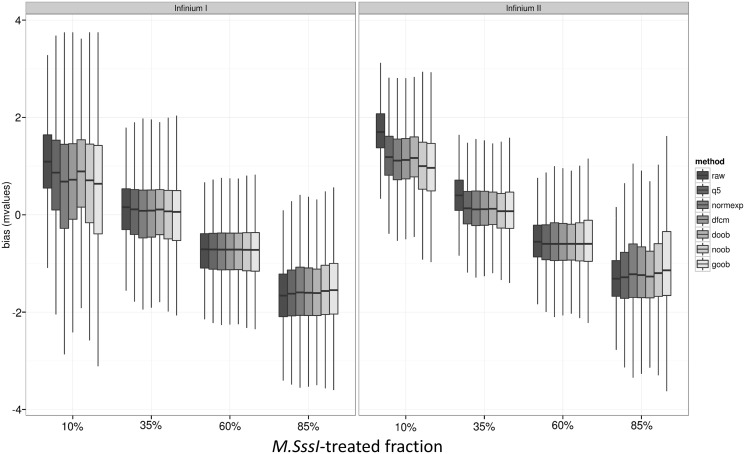
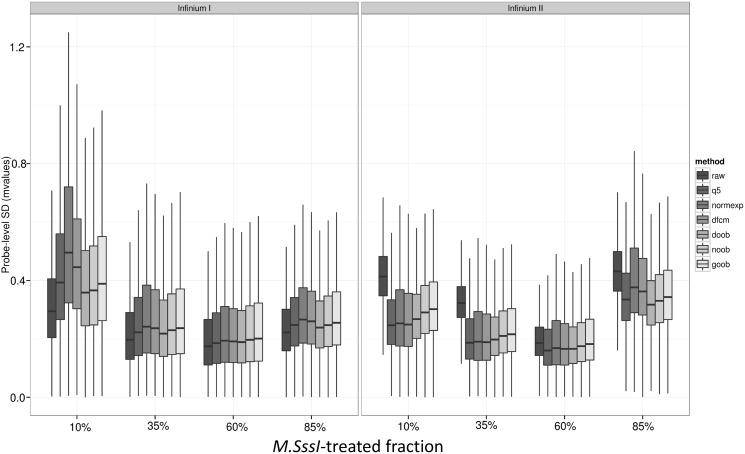
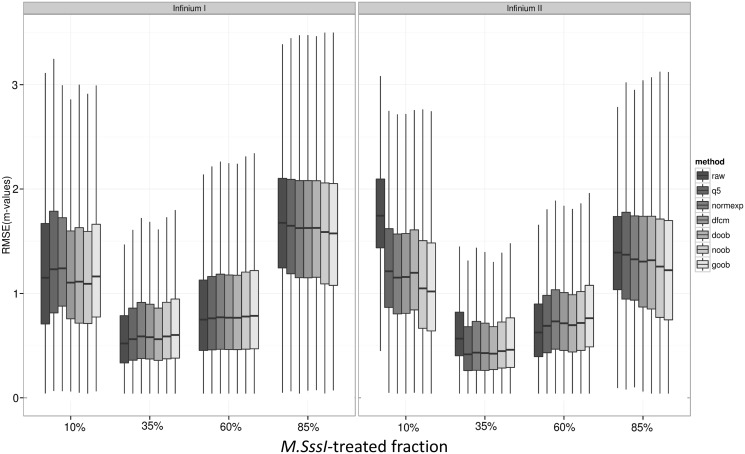
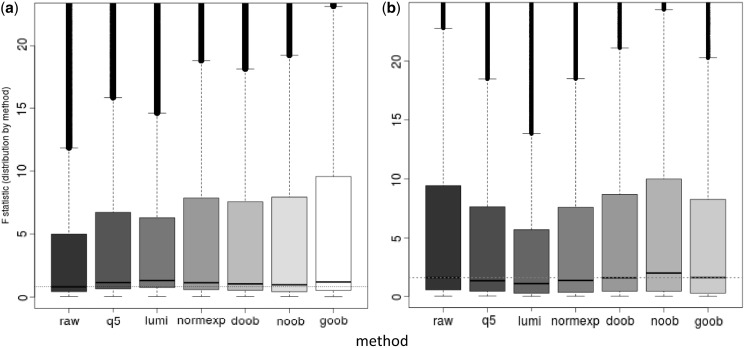
We propose a novel approach to background correction for Infinium HumanMethylation data to account for technical variation in background fluorescence signal. Our approach capitalizes on a new use for the Infinium I design bead types to measure non-specific fluorescence in the colour channel opposite of their design (Cy3/Cy5). This provides tens of thousands of features for measuring background instead of the much smaller number of negative control probes on the platforms (n = 32 for HumanMethylation27 and n = 614 for HumanMethylation450, respectively). We compare the performance of our methods with existing approaches, using technical replicates of both mixture samples and biological samples, and demonstrate that within- and between-platform artefacts can be substantially reduced, with concomitant improvement in sensitivity, by the proposed methods.


Figures

Figure 1.
Figure 1.
Distribution of negative control and out-of-band fluorescent probes for two PBL replicate samples on the HM27 and HM450 arrays.
Figure 2.
Figure 2.
Density plots for six PBL replicate samples on the HM450 arrays before and after processing (left and right columns, respectively) (P = 482 421 targeted CpGs). Processed data were corrected by the Normal exponential convolution using out-of-band Infinium I probes (noob) and dye-bias equalization. Row 1: Methylated allele intensities; row 2: Unmethylated allele intensities; row 3: Beta values.
Figure 3.
Figure 3.
Boxplot of the probe-specific standard deviation of (a) Beta values and (b) M-values by background-correction method: none (raw), background subtraction using negative control probes (q5), background subtraction using methylated allele intensities (lumi), Normal exponential convolution using negative control probes (normexp), distribution-free convolution using negative control probes (dfcm), distribution-free convolution using out-of-band Infinium I probes (doob), Normal exponential convolution using out-of-band Infinium I probes (noob), Gamma convolution using out-of-band Infinium I probes (goob) (n = 6 PBL replicates on HM450, P = 482 421 targeted CpGs). Dye-bias equalization is also applied for all background-corrected data.
Figure 4.
Figure 4.
Boxplot of probe-specific bias in M-values by background-correction method: none (raw), background subtraction using negative control probes (q5), Normal exponential convolution using negative control probes (normexp), distribution-free convolution using negative control probes (dfcm), distribution-free convolution using out-of-band Infinium I probes (doob), Normal exponential convolution using out-of-band Infinium I probes (noob), Gamma convolution using out-of-band Infinium I probes (goob) [n = 4 replicates each of four mixtures samples, P = 255 594 CpG targets, filtering out features methylated in the 10% M.SssI-treated fraction (average beta > 0.65)]. Dye-bias equalization is also applied for all background-corrected data, and probes are stratified by Infinium I and II design.
Figure 5.
Figure 5.
Boxplot of probe-specific standard deviation in M-values by background correction method: none (raw), background subtraction using negative control probes (q5), Normal exponential convolution using negative control probes (normexp), distribution-free convolution using negative control probes (dfcm), distribution-free convolution using out-of-band Infinium I probes (doob), Normal exponential convolution using out-of-band Infinium I probes (noob), Gamma convolution using out-of-band Infinium I probes (goob) [n = 4 replicates each of four mixtures samples, P = 255 594 CpG targets, filtering out features methylated in the 10% M.SssI-treated fraction (average beta > 0.65)]. Dye-bias equalization is also applied for all background-corrected data, and probes are stratified by Infinium I and II design.
Figure 6.
Figure 6.
Boxplot of probe-specific root mean squared error (RMSE) of M-values by background-correction method: none (raw), background subtraction using negative control probes (q5), Normal exponential convolution using negative control probes (normexp), distribution-free convolution using negative control probes (dfcm), distribution-free convolution using out-of-band Infinium I probes (doob), Normal exponential convolution using out-of-band Infinium I probes (noob), Gamma convolution using out-of-band Infinium I probes (goob) [n = 4 replicates each of four mixtures samples, P = 255 594 CpG targets, filtering out features methylated in the 10% M.SssI-treated fraction (average beta > 0.65)]. Dye-bias equalization is also applied for all background-corrected data, and probes are stratified by Infinium I and II design.
Figure 7.
Figure 7.
(a) Boxplot of probe-specific ANOVA F-statistic of M-values for 160 HM27 arrays of 77 HapMap samples (72 duplicates, 4 triplicates and 1 quadruplicate) by background-correction method: none (raw), background subtraction using negative control probes (q5), background subtraction using methylated allele intensities (lumi), Normal exponential convolution using negative control probes (normexp), distribution-free convolution using out-of-band Infinium I probes (doob), Normal exponential convolution using out-of-band Infinium I probes (noob), Gamma convolution using out-of-band Infinium I probes (goob). (P = 25 913 CpG targets, filtering out features with SNPs at targeted CpGs). (b) Boxplot of probe-specific ANOVA F-statistic of M-values for 192 acute myeloid leukaemia samples from the Cancer Genome Atlas project, run on both HM27 and HM450 arrays, arranged by background-correction method (left to right): none (raw), q5, lumi, normexp, doob, noob, goob. See part (a) for full name of method. (P = 23 740 features overlapping both platforms, SNPs omitted). There are 2243 (9%) features using chemistry I on both platforms, and there are 21 497 (91%) features using chemistry I on HM27 and chemistry 2 on HM450, among those probes shared between the two platforms.

References

    1. Bird A. DNA methylation patterns and epigenetic memory. Genes Dev. 2002;16:6–21. - PubMed
    1. Sandoval J, Heyn HA, Moran S, Serra-Musach J, Pujana MA, Bibikova M, Esteller M. Validation of a DNA methylation microarray for 450,000 CpG sites in the human genome. Epigenetics. 2011;6:692–702. - PubMed
    1. Siegmund KD. Statistical approaches for the analysis of DNA methylation microarray data. Hum. Genet. 2011;129:585–595. - PMC - PubMed
    1. Xie Y, Wang X, Story M. Statistical methods of background correction for Illumina BeadArray data. Bioinformatics. 2009;25:751–757. - PMC - PubMed
    1. Verdugo RA, Deschepper CF, Muñoz G, Pomp D, Churchill GA. Importance of randomization in microarray experimental designs with Illumina platforms. Nucleic Acids Res. 2009;37:5610–5618. - PMC - PubMed

Publication types

Substances