. 2013 Mar 18;23(3):302-15.
doi: 10.1016/j.ccr.2013.02.003. Epub 2013 Mar 7.

Oncogenic BRAF regulates oxidative metabolism via PGC1α and MITF

Affiliations

Oncogenic BRAF regulates oxidative metabolism via PGC1α and MITF

Rizwan Haq et al. Cancer Cell. .

Abstract

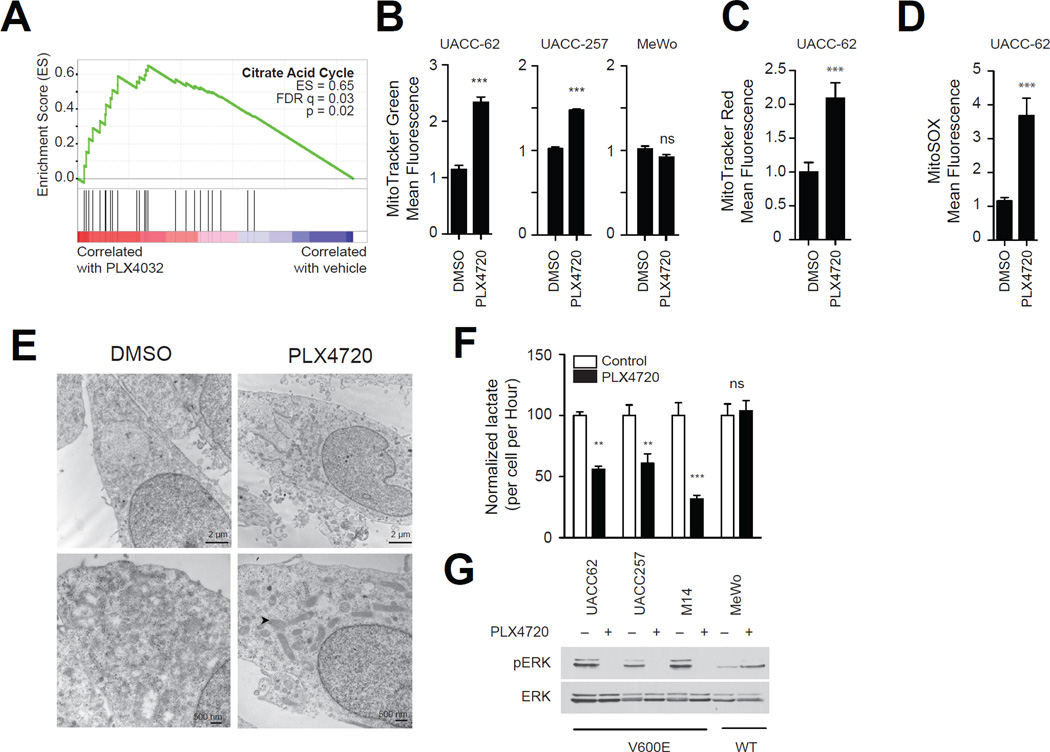
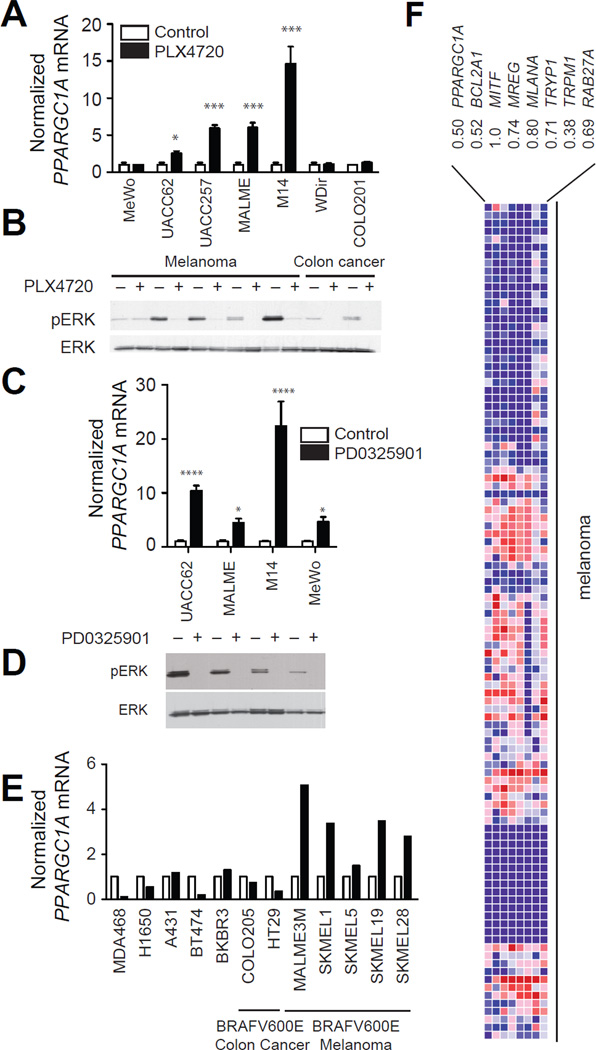
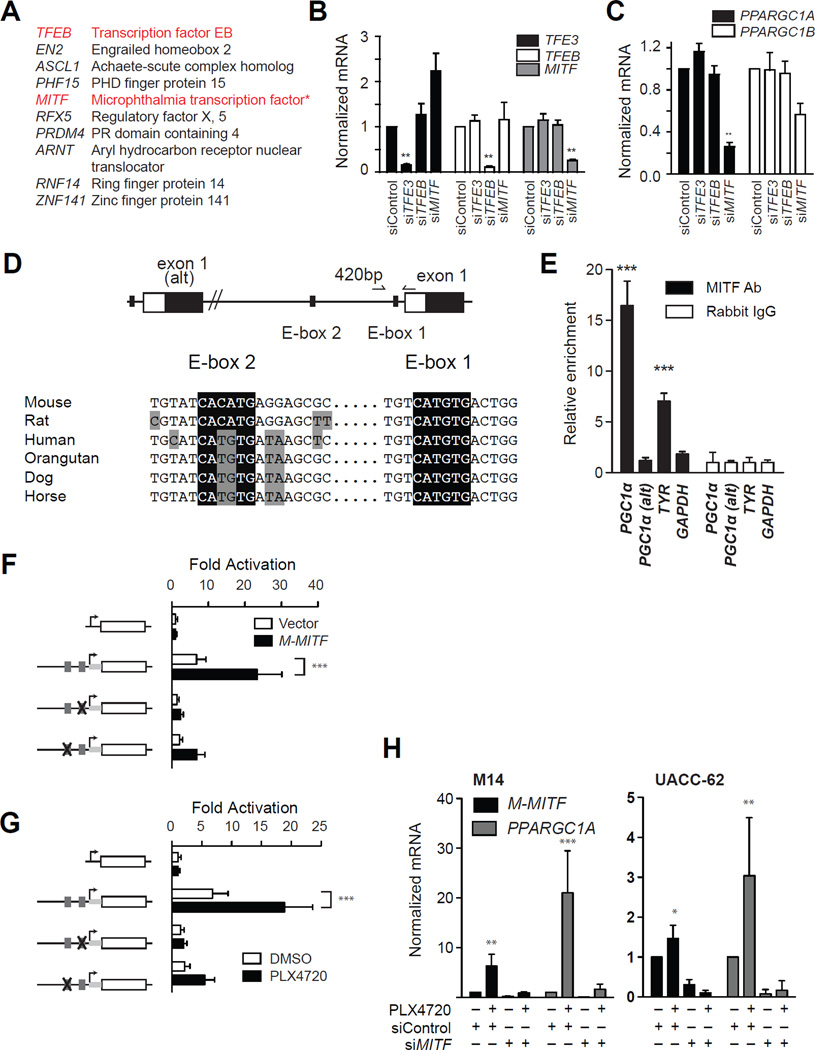
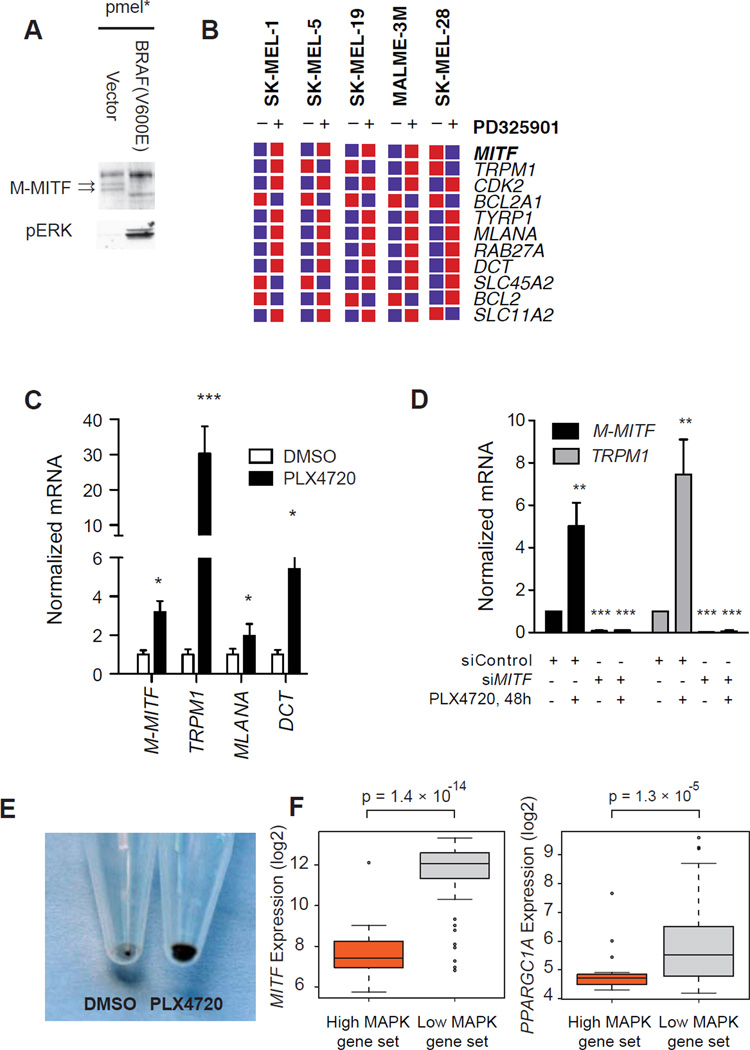
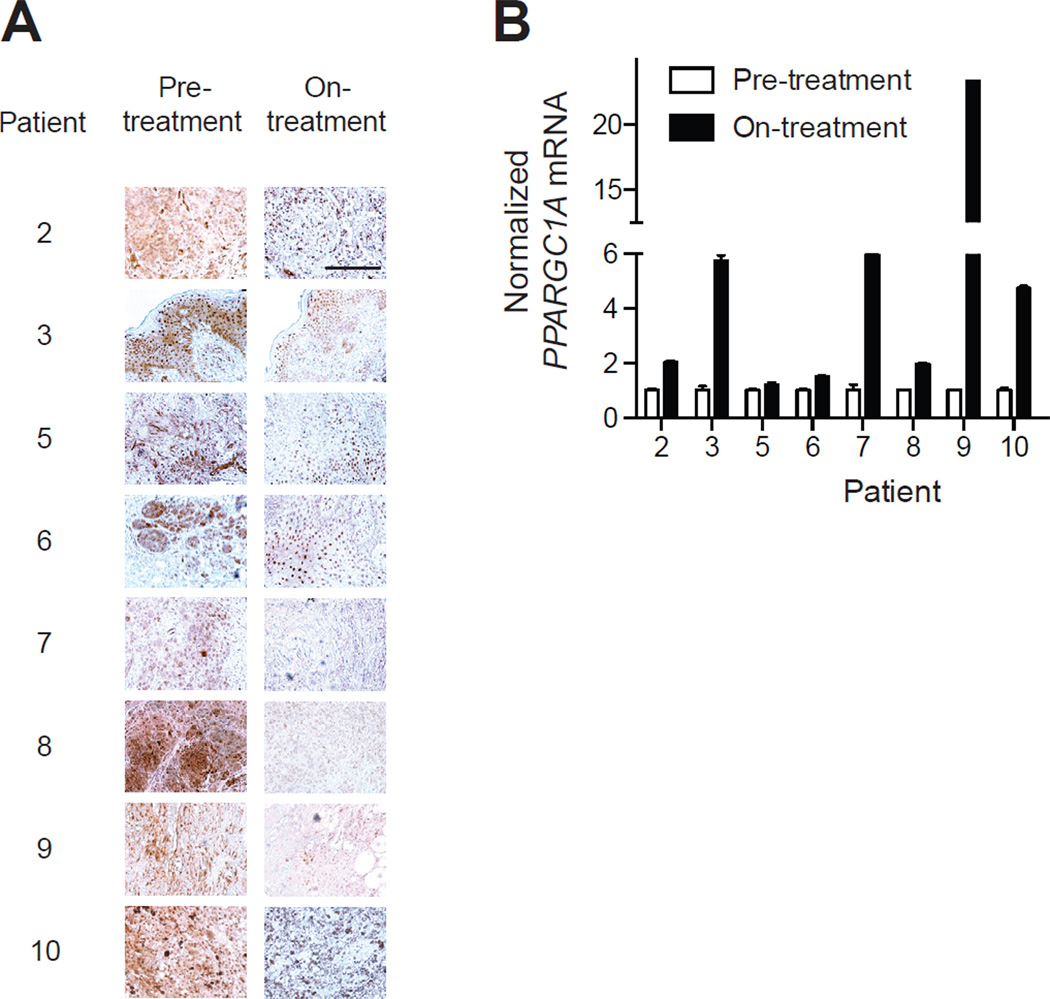
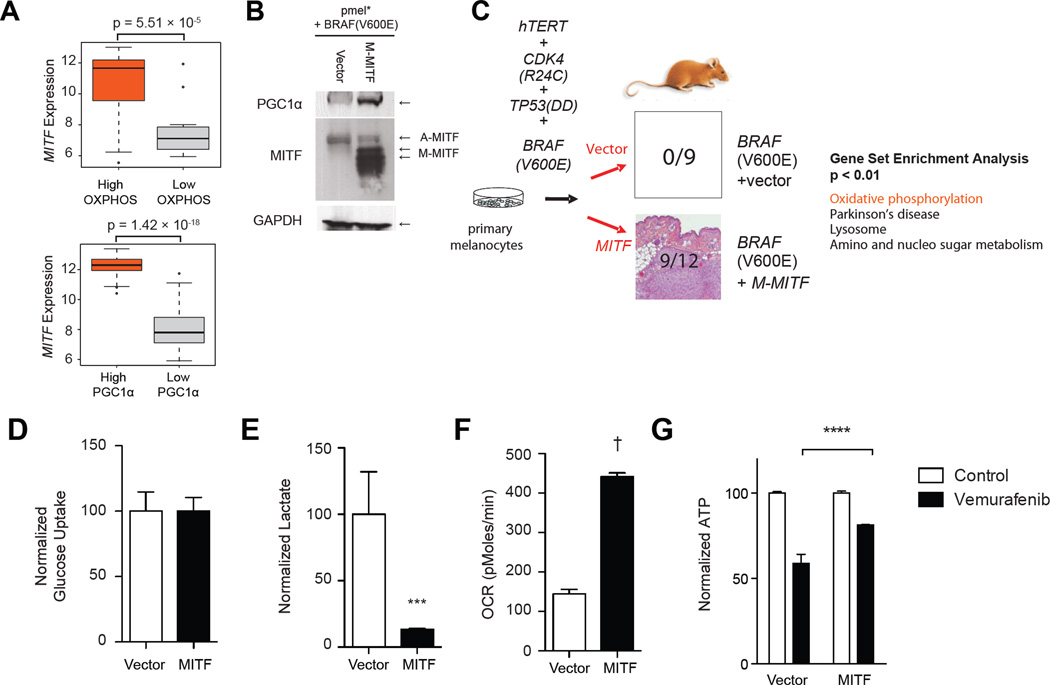
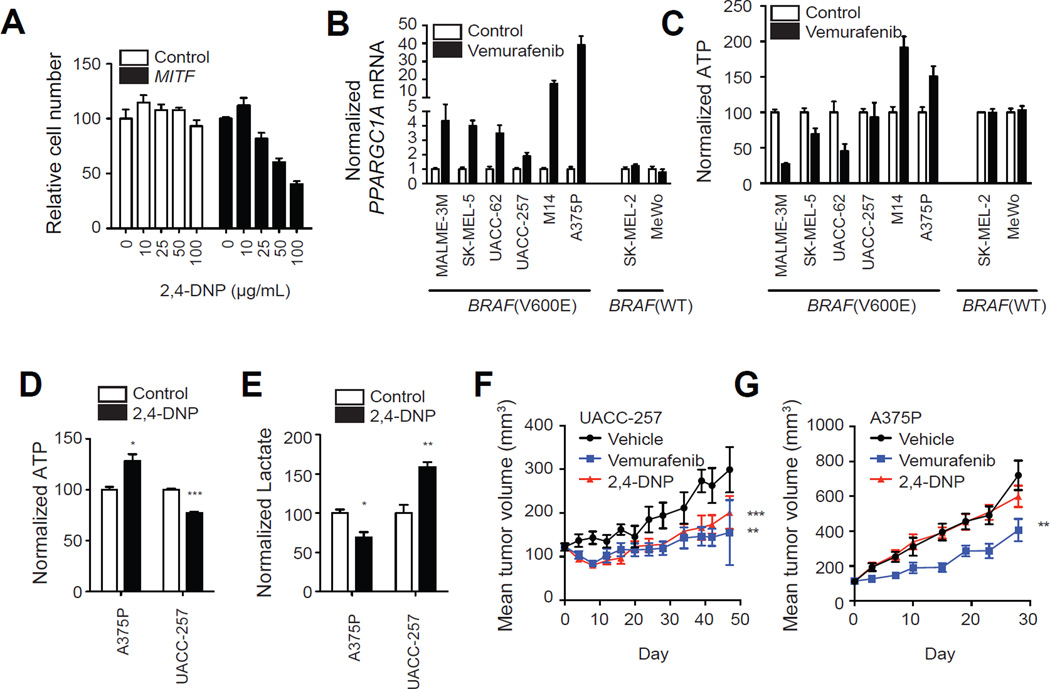
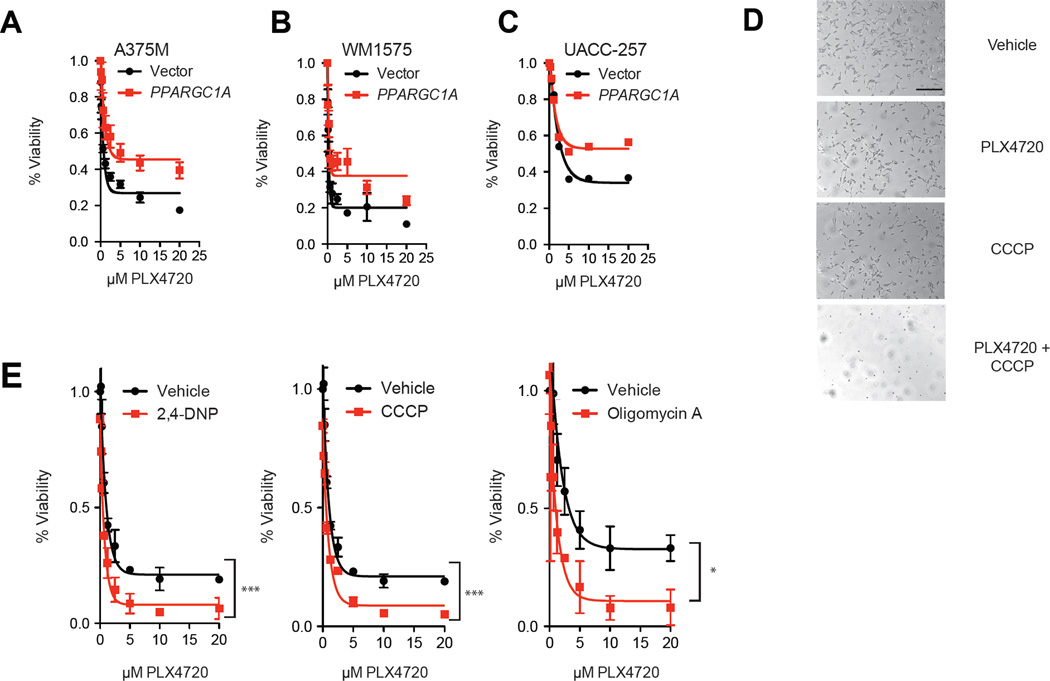
Activating mutations in BRAF are the most common genetic alterations in melanoma. Inhibition of BRAF by small molecules leads to cell-cycle arrest and apoptosis. We show here that BRAF inhibition also induces an oxidative phosphorylation gene program, mitochondrial biogenesis, and the increased expression of the mitochondrial master regulator, PGC1α. We further show that a target of BRAF, the melanocyte lineage factor MITF, directly regulates the expression of PGC1α. Melanomas with activation of the BRAF/MAPK pathway have suppressed levels of MITF and PGC1α and decreased oxidative metabolism. Conversely, treatment of BRAF-mutated melanomas with BRAF inhibitors renders them addicted to oxidative phosphorylation. Our data thus identify an adaptive metabolic program that limits the efficacy of BRAF inhibitors.


Figures

Figure 1
Figure 1
BRAF inhibitors induce mitochondrial biogenesis and oxidative metabolism. (A) Gene Set Enrichment Analysis plot of melanoma cells treated with vemurafenib showing the most significantly changed gene set. FDR, false-discovery rate; ES, enrichment score. (B) MitoTracker Green fluorescence of BRAF mutant (UACC-62 and UACC-257) or BRAF wild-type (MeWo) melanoma cell lines treated with PLX4720 (1µM, 72h) and subjected to analysis by flow cytometry. (C,D) MitoTracker Red fluorescence (C) or MitoSOX fluorescence (D) of UACC-62 cells treated with PLX4720. (E) Electron micrographs of UACC-62 cells treated with PLX4720 or vehicle control. Representative photographs of cells at 22000× (upper panel) or 44000× (lower panel) are shown. Arrows indicate mitochondria. (F) Lactate levels in media conditioned from the indicated cell lines treated with PLX4720 or vehicle control for 16 hours. (G) Cells in part (F) were concomitantly evaluated for ERK activity by Western blotting using phospho-ERK antibodies. Error bars represent SEM of at least three independent replicates. ***, p < 0.001; **, p < 0.01. See also Table S1 and Figure S1.
Figure 2
Figure 2
BRAF inhibitors induce PGC1α expression. PGC1α mRNA (A) and phospho-ERK levels (B) in melanoma or colon cancer cells treated with PLX4720 (1µM) for 24h. PGC1α mRNA (C) and ERK activity (D) in melanoma cells treated with the MEK inhibitor PD0325901 (10nM) for 24h. (E) Microarray analysis (GSE10086) of PGC1α mRNA in cell lines treated with 10nM PD0325901 for 24h. (F) Comparison of PGC1α mRNA with MITF, melanocytic markers, and MITF targets in 105 melanoma cell cultures (Hoek et al., 2006). Pearson correlation coefficient is shown below each gene. Error bars represent SEM of at least three independent replicates. ****, p < 0.0001; ***, p < 0.001; *, p < 0.01. See also Figure S2.
Figure 3
Figure 3
PGC1α is regulated by MITF in the melanocytic lineage. (A) Top 10 transcription factors correlated to PGC1α mRNA in (Lin et al., 2008). *, q < 0.05. (C) Requirement of MiT family members for PGC1α expression in M14 melanoma cells. Knockdown of each family member is shown in (B). ****, p < 0.0001; **, p < 0.01. (D) Structure of PGC1α promoter in mammalian species showing the location of alterative exon 1 and exon 1. Also depicted are the locations of E-box #1 and E-box #2 and primers used for chromatin-immunoprecipitation. (E) Chromatin immunopreciptation of indicated genomic region with anti-MITF, or rabbit IgG in primary melanocytes. Precipitated DNA was amplified using primers depicted in (D). ***, p < 0.001 compared to Rabbit IgG control. (F,G) Activity of PGC1α promoters upstream of the luciferase gene mutated as depicted in response to transfection of MITF (f) or treatment with PLX4720 (G). Grey boxes indicate the location of E-boxes. (H) Expression of PGC1α following knockdown of MITF (48h) and treatment with PLX4720 (1µM, 24h) in M14 cells (left) or UACC-62 cells (right). Error bars represent SEM of at least three independent replicates. ***, p < 0.001. See also Figure S3.
Figure 4
Figure 4
BRAF suppresses MITF expression and activity. (A) Levels of M-MITF (arrows) and phosphorylated ERK in pmel* and pmel* BRAF (V600E). (B) Effects of MEK inhibitor PD0325901 on MITF mRNA and MITF targets by published microarray (Pratilas et al., 2009). (C) Response of MITF and MITF targets to PLX4720 in UACC-257 cells by quantitative PCR. *, p < 0.01; ***, p < 0.001 relative to DMSO control. (D) Effect of MITF suppression on induction of MITF-target TRPM1 by PLX4720. **, p < 0.01; ***, p < 0.001 relative to siControl. Error bars represent SEM of at least three independent replicates. (E) Consequence of PLX4720 (72h) on UACC-257 pigmentation. Equal number of cells were pelleted by centrifugation. (F) Box-plots showing expression of MITF (left) and PGC1α in melanoma cells with high or low MAPK activation from 88 short-term melanoma cultures (Lin et al., 2008).
Figure 5
Figure 5
Validation of induction of PGC1α pathway in vivo following BRAF inhibition. (A) Expression of phospho-ERK in eight matched patient biopsies prior or during (10–14 days) of treatment with BRAF/MEK inhibitors. (B) Expression of PGC1α mRNA prior and during treatment with BRAF/MEK inhibitors. Error bars represent SEM of at least three technical replicates. Scale bar represents 100 µm.
Figure 6
Figure 6
MITF regulates oxidative phosphorylation. (A) Box plots depicting MITF expression in melanomas with high expression of a PGC1α-target gene set (bottom) or oxidative phosphorylation gene set (top). (B) Western blotting showing expression of MITF and PGC1α in pmel* BRAF(V600E) with and without MITF overexpression. (C) Schema showing isogenic system evaluating the effect of MITF overexpression in BRAF(V600E) melanoma cells. The tumorigenicity of the paired cell lines was assessed in FoxNnu mice and the number of formed tumors per injection of each cell line is shown. Gene set enrichment analysis of the paired cell lines with the most highly induced gene sets is shown (right). Glucose uptake (D), lactate levels (E) and oxygen consumption (F) were measured as relative amounts in each cell line, normalized to cell number. (G) ATP levels, normalized to cell number in BRAF(V600E)+vector and BRAF(V600E)+MITF treated with PLX4032 (1µM) for 24h. ***, p < 0.001 compared to control cells. Error bars represent SEM of at least three independent replicates. See also Figure S4.
Figure 7
Figure 7
Effects of 2,4-DNP on growth melanoma cells in vitro and in vivo. (A) Number of BRAF(V600E)+vector and BRAF(V600E)+MITF melanoma cells following treatment with 2,4- DNP with indicated dose for 72h. Levels of PGC1α mRNA (B) and ATP (C) in melanoma cell lines treated with vemurafenib (1µM) for 24h. Effects of 2,4-DNP (50 µg/mL, 24h) on ATP (D) and lactate levels (E) in indicated cell lines in vitro. (F,G) Effect of 2,4-DNP (20 mg/kg/day) or vemurafenib (75 mg/kg/day) on murine xenografts of indicated cell line (N = 7–8 per group). **, p < 0.01 compared to vehicle group; ***, p < 0.001 compared to vehicle group. Error bars represent SEM of at least three independent replicates. See also Figure S5.
Figure 8
Figure 8
BRAF inhibitors enhance dependence on mitochondrial metabolism. Sensitivity of A375M (A), WM1575 (B) and UACC-257 (C) melanoma cells overexpressing PGC1α to treatment with PLX4720 for 72 hours. (D) Photograph of M14 cells treated with PLX4720 (5µM), CCCP (20µM) or the combination for 72 hrs. Scale bar represents 100 µm. (E) Cell number following treatment with mitochondrial uncouplers oligomycin A (1µM), CCCP (5µM) or 2,4-DNP (200 µg/mL). Cell number was estimated after 72 hrs of treatment. *, p < 0.05 compared to control; **, p < 0.01 compared to control; ***, p < 0.001 compared to control. Error bars represent SEM of at least three independent replicates. See also Figure S6.

Comment in

References

    1. Arany Z, Foo SY, Ma Y, Ruas JL, Bommi-Reddy A, Girnun G, Cooper M, Laznik D, Chinsomboon J, Rangwala SM, et al. HIF-independent regulation of VEGF and angiogenesis by the transcriptional coactivator PGC-1alpha. Nature. 2008;451:1008–1012. - PubMed
    1. Bensaad K, Tsuruta A, Selak MA, Vidal MNC, Nakano K, Bartrons R, Gottlieb E, Vousden KH. TIGAR, a p53-Inducible Regulator of Glycolysis and Apoptosis. Cell. 2006;126:107–120. - PubMed
    1. Bertolotto C, Lesueur F, Giuliano S, Strub T, de Lichy M, Bille K, Dessen P, d’Hayer B, Mohamdi H, Remenieras A, et al. A SUMOylation-defective MITF germline mutation predisposes to melanoma and renal carcinoma. Nature. 2011;480:94–98. - PubMed
    1. Bhalla K, Hwang BJ, Dewi RE, Ou L, Twaddel W, Fang HB, Vafai SB, Vazquez F, Puigserver P, Boros L, et al. PGC1 Promotes Tumor Growth by Inducing Gene Expression Programs Supporting Lipogenesis. Cancer Research. 2011;71:6888–6898. - PMC - PubMed
    1. Board RE, Ellison G, Orr MCM, Kemsley KR, McWalter G, Blockley LY, Dearden SP, Morris C, Ranson M, Cantarini MV, et al. Detection of BRAF mutations in the tumour and serum of patients enrolled in the AZD6244 (ARRY-142886) advanced melanoma phase II study. Br J Cancer. 2009;101:1724–1730. - PMC - PubMed

Publication types

MeSH terms

Associated data