. 2013 Mar 28;3(3):587-94.
doi: 10.1016/j.celrep.2013.02.006. Epub 2013 Mar 7.

Protection of neuronal diversity at the expense of neuronal numbers during nutrient restriction in the Drosophila visual system

Affiliations

Protection of neuronal diversity at the expense of neuronal numbers during nutrient restriction in the Drosophila visual system

Elodie Lanet et al. Cell Rep. .

Abstract

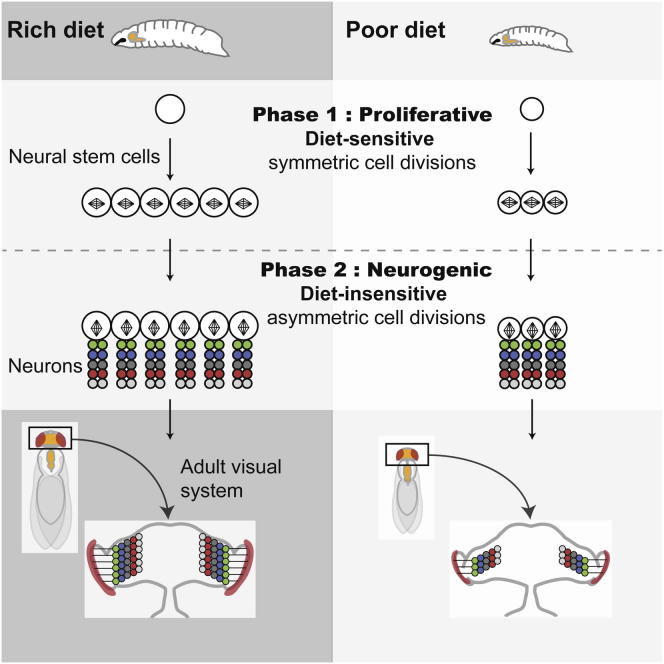
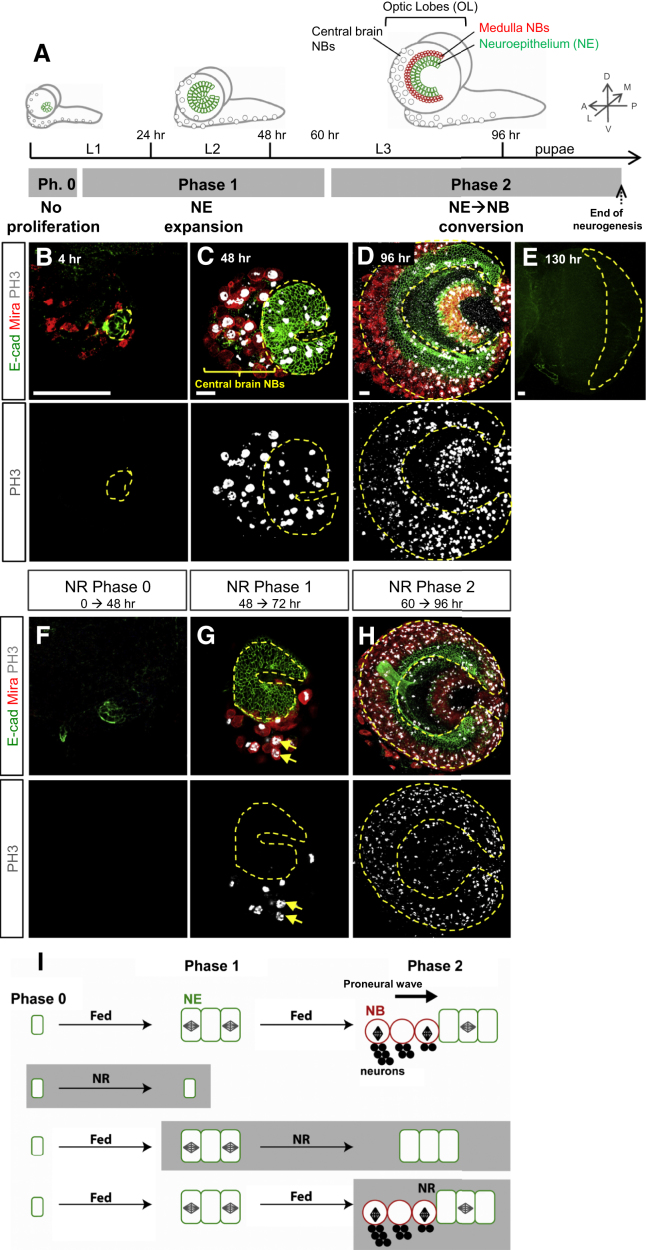
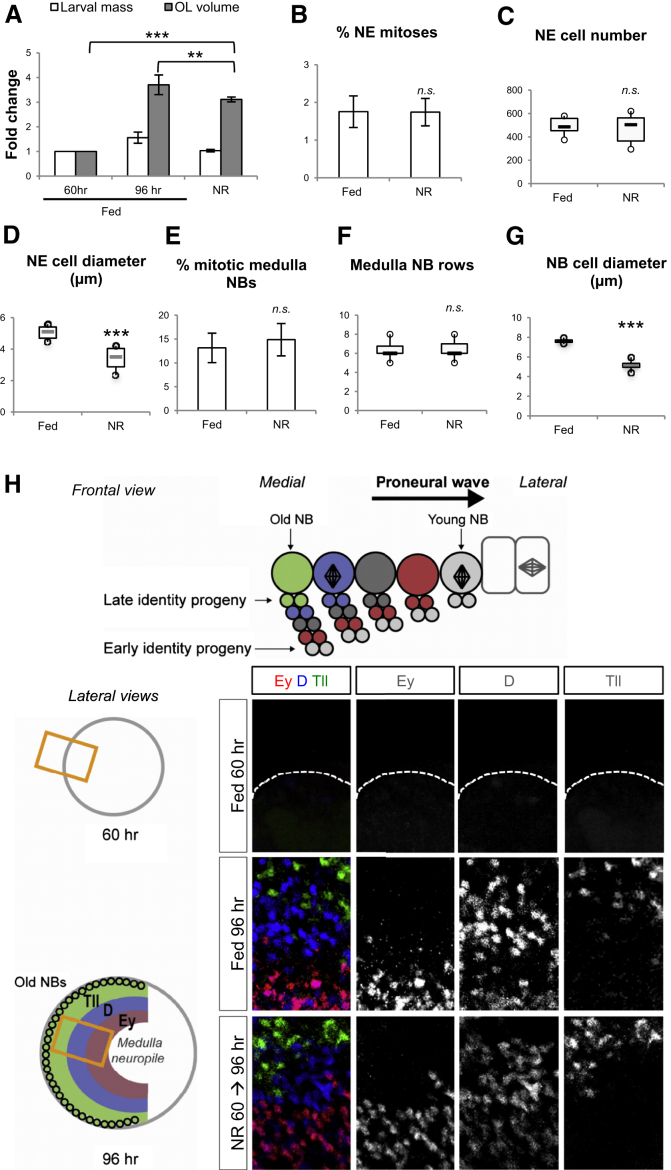
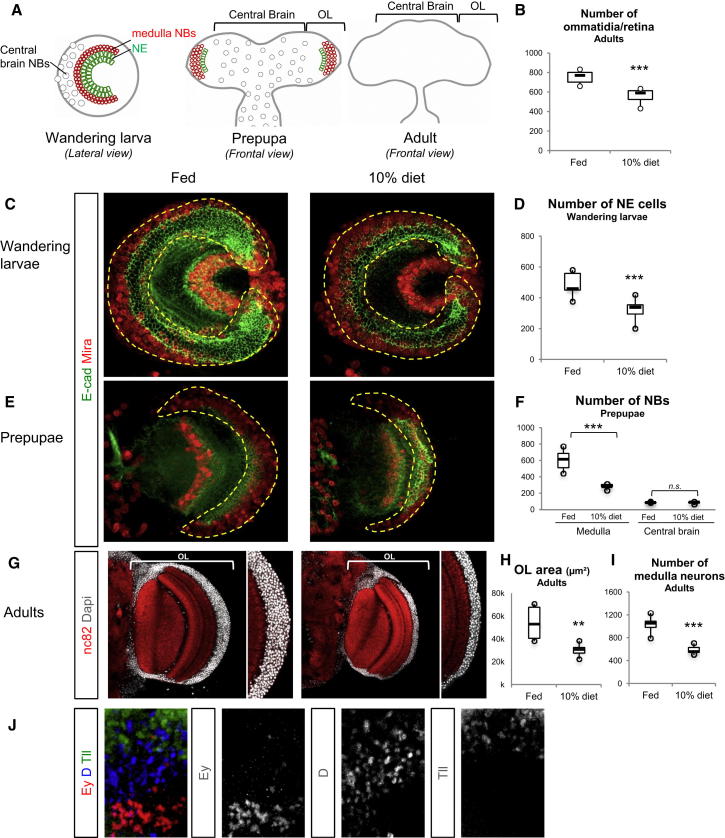
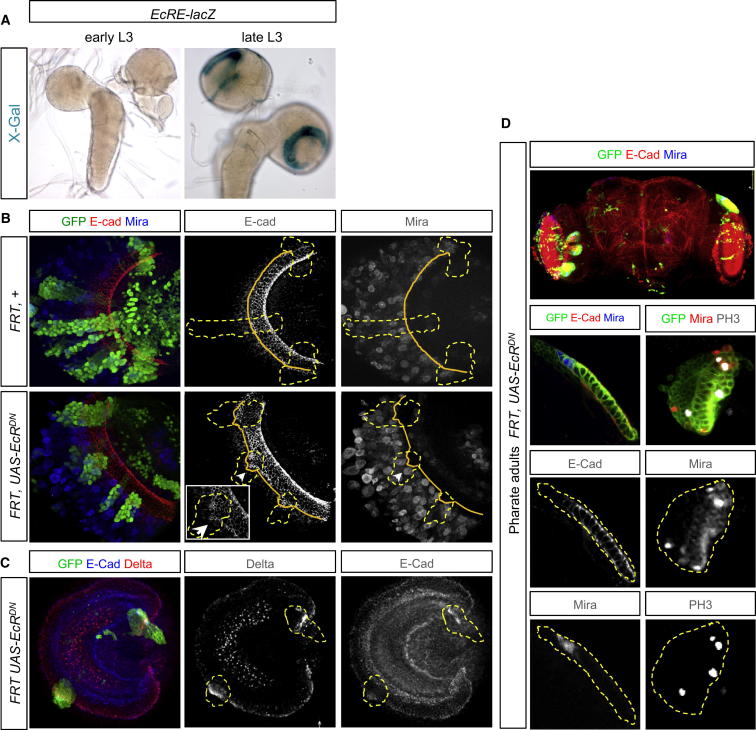
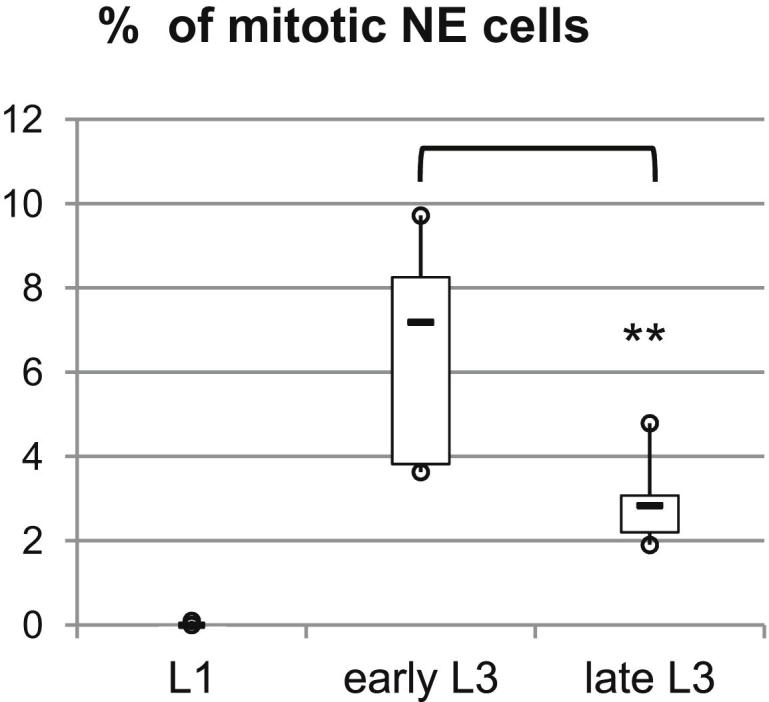
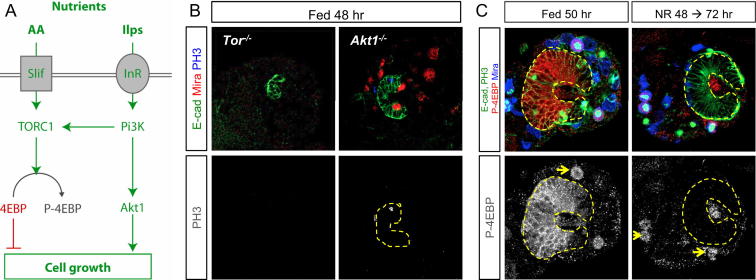
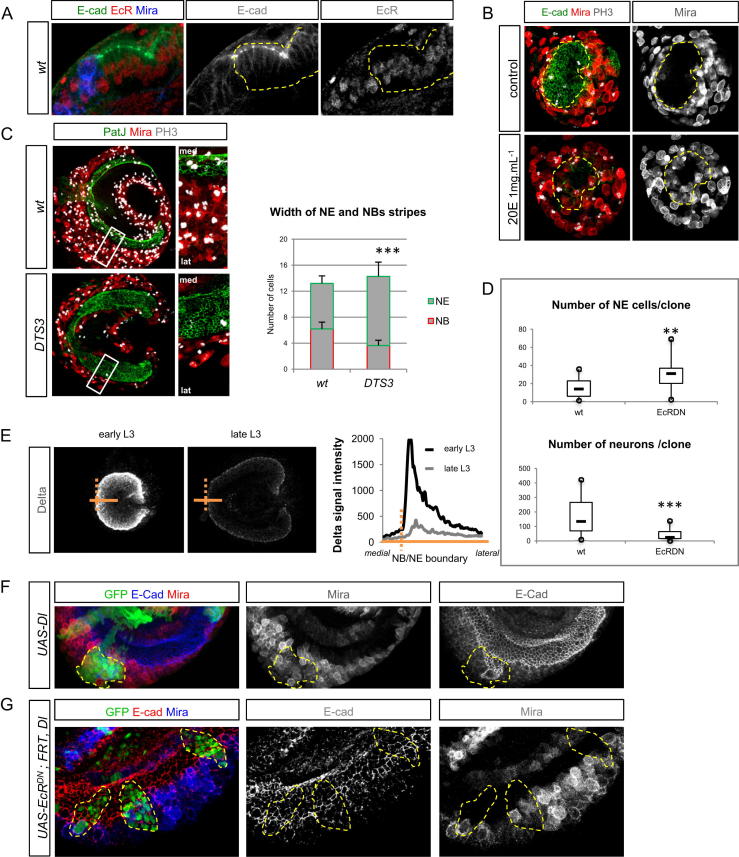
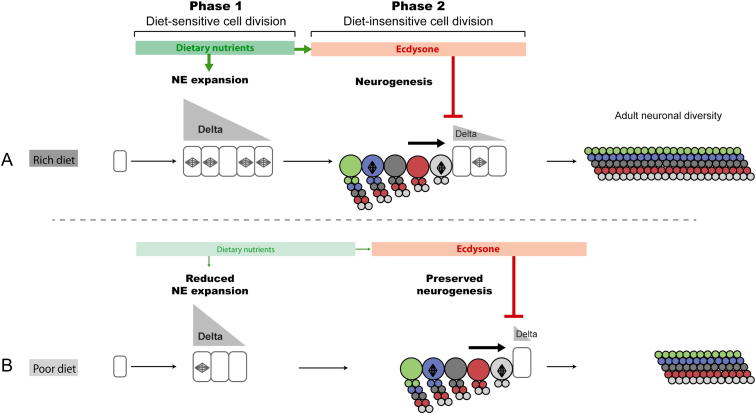
Systemic signals provided by nutrients and hormones are known to coordinate the growth and proliferation of different organs during development. However, within the brain, it is unclear how these signals influence neural progenitor divisions and neuronal diversity. Here, in the Drosophila visual system, we identify two developmental phases with different sensitivities to dietary nutrients. During early larval stages, nutrients regulate the size of the neural progenitor pool via insulin/PI3K/TOR-dependent symmetric neuroepithelial divisions. During late larval stages, neural proliferation becomes insensitive to dietary nutrients, and the steroid hormone ecdysone acts on Delta/Notch signaling to promote the switch from symmetric mitoses to asymmetric neurogenic divisions. This mechanism accounts for why sustained undernourishment during visual system development restricts neuronal numbers while protecting neuronal diversity. These studies reveal an adaptive mechanism that helps to retain a functional visual system over a range of different brain sizes in the face of suboptimal nutrition.


Figures

None
Graphical abstract
Figure 1
Figure 1
Nutritional Signals Control the Three Phases of NE Development In all figures of the article, images are projections of several confocal sections (except if stated otherwise). (A) Schematic drawings representing lateral views of a larval CNS from early L1 to late L3. Central brain and nerve cord neuroblasts (NBs) are represented as gray circles. In the OL, medulla NBs are represented as red circles, and neuroepithelial cells (NEs) are represented as green rectangles. Medulla NBs are smaller and also more densely packed than their central brain counterparts and form a characteristic horseshoe-shaped strip adjacent to the medial edge of the NE. 3D axis are presented as A-P, anterior-posterior; D-V, dorsal-ventral; M-L, medial-lateral. (B–E) Pictures show larval OL during the three periods of medulla development and a frontal view of a pupal OL (130 hr). The NE is stained by E-Cadherin (E-Cad; green), NBs are marked with Mira (red), and mitotic cells are marked with PH3 (white). The dotted yellow line delineates the medulla (NE and NBs). (B) Phase 0: inactive NE. (C) Phase 1: expansion. (D) Phase 2: NE → NB conversion. (E) At midpupae, no more NE cells and NBs are detected. (F) The NE of larvae submitted to NR conditions for 48 hr from hatching (phase 0) never initiate proliferation. (G) The NE of larvae starved from 48 hr ALH (phase 1) to 96 hr arrests proliferation (no PH3+ NE cells) and does not undergo NB conversion. Yellow arrows indicate central brain NBs that are still dividing in these conditions. (H) NR during phase 2 (from 60 to 96 hr) impacts neither on neural proliferation nor on NE → NB conversion. (I) Schematic representation of the results obtained from the NR experiments during the three periods of medulla development (F–H). See also Figure S1.
Figure 2
Figure 2
During Phase 2, Neural Progenitor Division and Neuronal Diversity Are Protected from NR (A) Larval body mass stops increasing under 60 → 96 hr NR conditions. In contrast, the optic lobe continues growing reaching 84% of its normal volume. Fold changes have been calculated from the following measurements: Larval mass: 60 hr fed (m = 1.45 mg, n = 30, SD = 0.09); 96 hr fed (m = 1.92 mg, n = 30, SD = 0.04); 96 hr NR (m = 1.475, n = 54, SD = 0.03); p < 0.001. OL diameters: fed 60 hr (m = 148.5 μm, n = 6, SD = 16.8); 96 hr fed (m = 230.6 μm, n = 24, SD = 26.2); 96 hr NR (m = 217.5 μm, n = 20, SD = 16.5). (B) The mitotic index in the NE does not significantly differ after 60 → 96 hr NR compared to fed larvae. Fed (m = 1.75, n = 8 OL, SD = 0.4); NR (m = 1.74, n = 6 OL, SD = 0.4); p > 0.05. (C) After 60 → 96 hr NR, the total number of NE cells in the medulla does not significantly differ compared to fed larvae. Fed (m = 493, n = 8, SD = 71); NR (m = 471, n = 6, SD = 133); p > 0.05. (D) After 60 → 96 hr NR, the apical diameter of NE cells significantly decreases compared to fed conditions. Fed (n = 6 OL, m = 5.00, SD = 0.46), NR (n = 6 OL, m = 3.40, SD = 0.76). ∗∗∗p < 0.001. (E) After 60 → 96 hr NR, the percentage of PH3+ medulla NBs does not significantly differ compared to fed larvae. Fed (m = 13.1%, n = 5 OL, SD = 3.0); NR (m = 14.8%, n = 4 OL, SD = 3.0); p > 0.05. (F) After 60 → 96 hr NR, the width of the NB strip does not significantly differ compared to fed larvae. Fed (m = 6.2, n = 14, SD = 0.8); NR (m = 6.3, n = 16, SD = 0.8); p > 0.05. (G) After 60 → 96 hr NR, the diameter of medulla NBs significantly decreases compared to fed conditions. Fed (n = 5 OL, m = 7.6, SD = 0.2), NR (n = 4 OL, m = 5.1, SD = 0.6). ∗∗∗p < 0.001. (H) A frontal cross-section view of the OL showing the proneural wave traversing the NE in a medial to lateral direction. Medulla NBs are represented as large circles, progeny as small circles and NE cells are represented as rectangles. Converted NBs express different temporal factors endowing progeny with different identity (color code) (X. Li, T. Erclik, C. Bertet, and C. Desplan, personal communication). On the lateral cross-section through 96 hr medulla, concentric layers of Ey+, D+, and Tll+ cells are visible (respectively colored in red, blue, and green on the scheme) representative of their birth order. At 60 hr, medulla neurons have not been generated yet. The curved edge of the optic lobe is indicated by a white dotted line. Between 60 and 96 hr, early (Ey+) and late (D+ and Tll+) identity progeny are generated in the medulla of both fed and NR larvae. Ey, red; D, blue; Tll, green.
Figure 3
Figure 3
Reduction of the Neural Progenitor Pool Size in Response to Suboptimal Nutritional Conditions Leads to Fewer Neurons Being Generated (A) Schematic drawings of the Drosophila OL in the CNS from three postembryonic stages. In the adult brain, neurogenesis has terminated and NE cells and NBs are not detected. (B) The number of ommatidia that compose the retina significantly decreases in adults that have developed in the 10% diet compared to fed condition. Fed (m = 754, n = 11, SD = 59); 10% (m = 568, n = 14, SD = 63); ∗∗∗p < 0.001. (C) Lateral views of OL from wandering larva reared in fed or 10% diet conditions. (D) The number of NE cells in wandering larvae significantly decreases in the 10% diet condition compared to fed. Fed (m = 516, n = 10 SD = 127); 10% (m = 354, n = 7 SD = 77); ∗∗∗p < 0.001. (E) Frontal view of a hemibrain from a 12-hr-old pupae. (C and E) The dotted yellow line delineates the medulla (NE and NBs). E-cad, green; Mira, red. (F) The number of NBs is significantly reduced in the medulla of 12-hr-old pupae reared 10% diet condition compared to fed. In contrast, it does not differ in the central brain (CB). Medulla: fed (m = 604, n = 6, SD = 126), 10% (m = 239, n = 5, SD = 32); ∗∗∗p < 0.001; CB: fed (m = 85, n = 5, SD = 6), 10% (m = 83, n = 5 SD = 12); p > 0.05. (G) Single frontal confocal section of a hemibrain from a 1-day-old adult. DAPI (gray) stains nuclei and nc82 (red) stains neuropils. (H) The area of the medulla is significantly reduced in 10% diet compared to fed animals. Fed (m = 53724, n = 8, SD = 14,636); 10% (m = 30,240, n = 5, SD = 5,459); ∗∗p < 0.01. (I) The number of medulla neurons per confocal section significantly decreases in 10% compared to fed condition. Fed (m = 1,070, n = 8, SD = 130); 10% (m = 607, n = 5, SD = 80); ∗∗∗p < 0.001. (J) As in the Fed condition, early (Ey+) and late (D+ and Tll+) identity neurons are generated in the medulla of wandering larvae reared in the 10% diet. Ey, red; D, blue; Tll, green.
Figure 4
Figure 4
Ecdysone Triggers NE → NB Conversion through the Downregulation of Delta and Is Required Cell Autonomously to Complete NE Elimination (A) X-gal staining demonstrates that EcRE-lacZ is specifically activated in the NE of late L3, but not in early L3. (B) In late L3, wild-type MARCM clones span the NE (E-cad, red) and NB (Mira, blue) populations. Clones misexpressing EcRDN exhibit a delayed proneural wave, as shown by the systematic presence of more medial E-cad staining inside clones compared to surrounding tissue. (C) Delta (red) is upregulated in EcRDN clones throughout the NE (blue). (D) EcRDN GFP+ clones in the pharate adult retain NE cells and NBs (E-cad, red; Mira, blue; see higher magnifications) that are still proliferating (Mira, red; PH3, white). See also Figure S3.
Figure S1
Figure S1
NE Proliferation Rate during Larval Stages, Related to Figure 1 During early L1 stage NE cells are quiescent and do not exhibit PH3 stainings (n = 6, m = 0.01%, SD = 0.04). Early L3 NEs exhibit more mitotic cells (n = 8, m = 6.5%, SD = 2.5) than late L3 NEs (n = 6, mean = 2.9%, SD = 1). ∗∗p < 0.01.
Figure S2
Figure S2
TOR/InR/Pi3K Signaling Promotes NE Expansion during Early Larval Stages, Related to Results (A) Simplified schematic representation of the TOR/InR/Pi3K network. In cells, amino-acid sensors respond to dietary nutrients by activating the TOR kinase, which phosphorylate 4E-BP to promote RNA translation. Organismal growth is regulated by Ilps that bind the InR to activate Pi3K and Akt1. Both pathways converge in promoting cell growth. The TOR kinase is a central node for nutrient sensing and cell growth activation. (B) The NE of TorΔP mutant larvae fails to initiate proliferation. In Akt11 mutants, NE expansion is also severely affected. E-cad (green), Mira (red), PH3 (white). (C) In the expanding NE of 50 hr larvae, 4E-BP is strongly phosphorylated. However, if the larvae is transferred to NR conditions for 24 hr, phosphorylated 4E-BP becomes undetectable in the NE, while still present in some central brain PH3+ neuroblasts (yellow arrows). The medulla is delineated by yellow dashed line. E-Cadherin and PH3 (green), p-4E-BP (red), Mira (blue).
Figure S3
Figure S3
Ecdysone Signaling Regulates Progenitor Pool Size via Delta, Related to Figure 4 (A) Frontal section through the medulla of a 96 hr larvae showing that NE cells (E-cad in green), express EcR (in red). (B) The NE of early L3 CNSs explanted for 24 hr in a culture medium containing 1mg/mL of 20E (20-hydroxyecdysone) is almost entirely converted in neuroblasts. In the control medium (1μg/ml of 20E), the NE continues dividing. E-cad (green), Mira (red), PH3 (white). (C) mldDTS3 is a temperature sensitive an allele of the zinc finger molting defective (mld) gene required for ecdysone biosynthesis in the prothoracic gland (Neubueser et al., 2005). A shift to the restrictive temperature (29°C) at early L3 abrogates the late-larval ecdysone pulse, allowing DTS3 mutant larvae to wander without pupariating for up to 15 days (Holden et al., 1986). The NE of mldDTS3 larvae, switched to restrictive temperatures for 6 days, is larger than the NE of wt late L3 larvae. Conversely, fewer NBs are produced in mldDTS3 mutants. E-cad (green), Mira (red), PH3 (white). The associated histogram depicts the average width of NE and medulla NB stripes in wt wandering L3 and mldDTS3 mutant larvae. The NE width is measured for the anterior half of the NE, and only NE cells located medial to the lamina furrow on the lateral side of the NE are taken in account. wt NE (n = 10, mean = 7.0, SD = 1.1), wt NB (n = 10, mean = 6.2, SD = 1); DTS3 NE (n = 11, mean = 10.6, SD = 2.2). DTS3 NB (n = 11, mean = 3.6 SD = 0.8). ∗∗∗p < 0.001. (D) Plots showing that the number of NE cells is increased in EcRDN clones compared to wt. wt (mean = 14.7, n = 25, SD = 9); EcRDN (mean = 29.5, n = 14, SD = 18). ∗∗p < 0.001. Plots showing that the number of neurons cells decreases by ∼70% in EcRDN clones compared to wt. wt (mean = 170, n = 17, SD = 134); EcRDN (mean = 45, n = 12, SD = 48). ∗∗∗p < 0.001. (E) Plot depicting the signal intensity of Delta in early and late NEs along a medial-to-lateral axis (orange line). Note that for both early and late stages, immunostaining and image acquisition were performed under the same conditions. (F) Clones misexpressing Delta delays NE-to-NB conversion. E-cad (blue), Mira (red). (G) Loss of Delta in EcRDN clones abrogates the delay in the progression of the proneural wave. GFP (green), E-cad (red) and Mira (blue).
Figure S4
Figure S4
A Strategy for Preserving Neuronal Diversity in the Medulla When Neuron Numbers Are Reduced by Suboptimal Nutrition, Related to Results (A) The NE undergoes a phase of expansion (phase 1) and a phase of conversion into neurogenic NBs (phase 2). NE expansion is promoted by nutrients through the TOR/InR/PI3K network, and is terminated by ecdysone that promotes NE-to-NB conversion during late larval stages (after 60 hr), through the downregulation of Delta. In contrast to phase 1, neural progenitor division during phase 2 is largely diet-insensitive ensuring that NBs generate their full repertoire of neurons independently of nutritional conditions. (B) Under suboptimal nutritional conditions (poor diet), NE expansion is impaired during phase 1, leading to a reduced neural progenitor pool by the end of larval stages. However, medulla neuroblasts, which are produced during the diet-insensitive phase 2, remain able to generate their normal set of progeny. Consequently, the neuron numbers in the brain are reduced but the diversity is preserved.

References

    1. Aguirre A., Rubio M.E., Gallo V. Notch and EGFR pathway interaction regulates neural stem cell number and self-renewal. Nature. 2010;467:323–327. - PMC - PubMed
    1. Brennan C.A., Ashburner M., Moses K. Ecdysone pathway is required for furrow progression in the developing Drosophila eye. Development. 1998;125:2653–2664. - PubMed
    1. Britton J.S., Edgar B.A. Environmental control of the cell cycle in Drosophila: nutrition activates mitotic and endoreplicative cells by distinct mechanisms. Development. 1998;125:2149–2158. - PubMed
    1. Brogiolo W., Stocker H., Ikeya T., Rintelen F., Fernandez R., Hafen E. An evolutionarily conserved function of the Drosophila insulin receptor and insulin-like peptides in growth control. Curr. Biol. 2001;11:213–221. - PubMed
    1. Brown H.L., Cherbas L., Cherbas P., Truman J.W. Use of time-lapse imaging and dominant negative receptors to dissect the steroid receptor control of neuronal remodeling in Drosophila. Development. 2006;133:275–285. - PubMed

Supplemental References

    1. Awad T.A., Truman J.W. Postembryonic development of the midline glia in the CNS of Drosophila: proliferation, programmed cell death, and endocrine regulation. Dev. Biol. 1997;187:283–297. - PubMed
    1. Bainbridge S.P., Bownes M. Staging the metamorphosis of Drosophila melanogaster. J. Embryol. Exp. Morphol. 1981;66:57–80. - PubMed
    1. Currie D.A., Milner M.J., Evans C.W. The growth and differentiation in vitro of leg and wing imaginal disc cells from Drosophila melanogaster. Development. 1988;102:805–814.
    1. Lee T., Luo L. Mosaic analysis with a repressible cell marker for studies of gene function in neuronal morphogenesis. Neuron. 1999;22:451–461. - PubMed
    1. Neubueser D., Warren J.T., Gilbert L.I., Cohen S.M. Molting defective is required for ecdysone biosynthesis. Dev. Biol. 2005;280:362–372. - PubMed

Publication types

MeSH terms

LinkOut - more resources