. 2013:3:1421.
doi: 10.1038/srep01421.

Effects of cold stress and heat stress on coral fluorescence in reef-building corals

Affiliations

Effects of cold stress and heat stress on coral fluorescence in reef-building corals

Melissa S Roth et al. Sci Rep. 2013.

Abstract

Widespread temperature stress has caused catastrophic coral bleaching events that have been devastating for coral reefs. Here, we evaluate whether coral fluorescence could be utilized as a noninvasive assessment for coral health. We conducted cold and heat stress treatments on the branching coral Acropora yongei, and found that green fluorescent protein (GFP) concentration and fluorescence decreased with declining coral health, prior to initiation of bleaching. Ultimately, cold-treated corals acclimated and GFP concentration and fluorescence recovered. In contrast, heat-treated corals eventually bleached but showed strong fluorescence despite reduced GFP concentration, likely resulting from the large reduction in shading from decreased dinoflagellate density. Consequently, GFP concentration and fluorescence showed distinct correlations in non-bleached and bleached corals. Green fluorescence was positively correlated with dinoflagellate photobiology, but its closest correlation was with coral growth suggesting that green fluorescence could be used as a physiological proxy for health in some corals.


Figures

Figure 1
Figure 1. Representative Acropora yongei samples from different treatments and time points during temperature change experiment.
Each sample includes an image under white light (left panel) and blue light (excitation 470 ± 40 nm and longpass emission filter ≥500 nm; right panel); the same coral sample from each treatment is shown through time. Scale bar represents 2 mm.
Figure 2
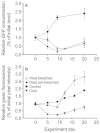
Figure 2. Effect of temperature change on the green fluorescent protein in corals over time.
(a) GFP concentration relative to initial levels (means ± s.e.m.; n = 4–5). (b) Green fluorescence (pixel intensity) relative to initials levels (means ± s.e.m.; n = 10–19 for 0–9 d, n = 4–9 for 12–20 d).
Figure 3
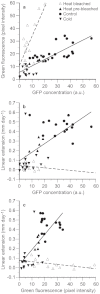
Figure 3. Relationship between GFP concentration and green fluorescence (a) and correlation between coral growth and GFP (b–c).
(a) GFP concentration and green fluorescence was distinctly correlated between non-bleached and bleached corals. Linear extension (coral growth) was significantly correlated with (b) GFP concentration and (c) green fluorescence for non-bleached corals, but not for bleached corals. In all panels, solid lines are for non-bleached corals, dashed lines for bleached corals.
Figure 4
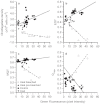
Figure 4. Correlations between green fluorescence and dinoflagellate population characteristics.
Green fluorescence was significantly correlated with (a) dinoflagellate density in non-bleached corals and in bleached corals, (b) effective quantum yield in non-bleached corals and in bleached corals, (c) maximum quantum yield in non-bleached corals and in bleached corals, and (d) pressure over PSII (Qmax) in non-bleached corals and bleached corals. Solid lines represent correlations between green fluorescence and non-bleached corals, and dashed lines represent correlations between green fluorescence and bleached corals. Chlorophyll measurements could not be obtained for the heat treatment at 20 d due to the large reduction in dinoflagellate density (see Methods).
Figure 5
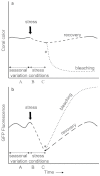
Figure 5. Conceptual model of (a) coral color and (b) GFP fluorescence during the life of an adult coral colony.
Phase (A) represents a healthy coral with seasonal variation (solid line), (B) indicates stress conditions such as an environmental change (dashed line), and (C) represents the trajectory of coral acclimating/recovering (long dashed line) or if the coral continues to decline until bleached (dotted line). The asterisk represents the onset of coral bleaching.

References

    1. Costanza R. et al. The value of the world's ecosystem services and natural capital. Nature 387, 253–260 (1997).
    1. Hughes T. P. et al. Climate change, human impacts, and the resilience of coral reefs. Science 301, 929–933 (2003). - PubMed
    1. Hoegh-Guldberg O. et al. Coral reefs under rapid climate change and ocean acidification. Science 318, 1737–1742 (2007). - PubMed
    1. Bruno J. F. & Selig E. R. Regional decline of coral cover in the Indo-Pacific: Timing, extent, and subregional comparisons. PLoS ONE 2, e711 (2007). - PMC - PubMed
    1. Baker A. C., Glynn P. W. & Riegl B. Climate change and coral reef bleaching: An ecological assessment of long-term impacts, recovery trends and future outlook. Estuar. Coast. Shelf Sci. 80, 435–471 (2008).

Publication types

Substances

LinkOut - more resources