. 2013 May;14(5):450-7.
doi: 10.1038/embor.2013.32. Epub 2013 Mar 12.

Rab12 regulates mTORC1 activity and autophagy through controlling the degradation of amino-acid transporter PAT4

Affiliations

Rab12 regulates mTORC1 activity and autophagy through controlling the degradation of amino-acid transporter PAT4

Takahide Matsui et al. EMBO Rep. 2013 May.

Abstract

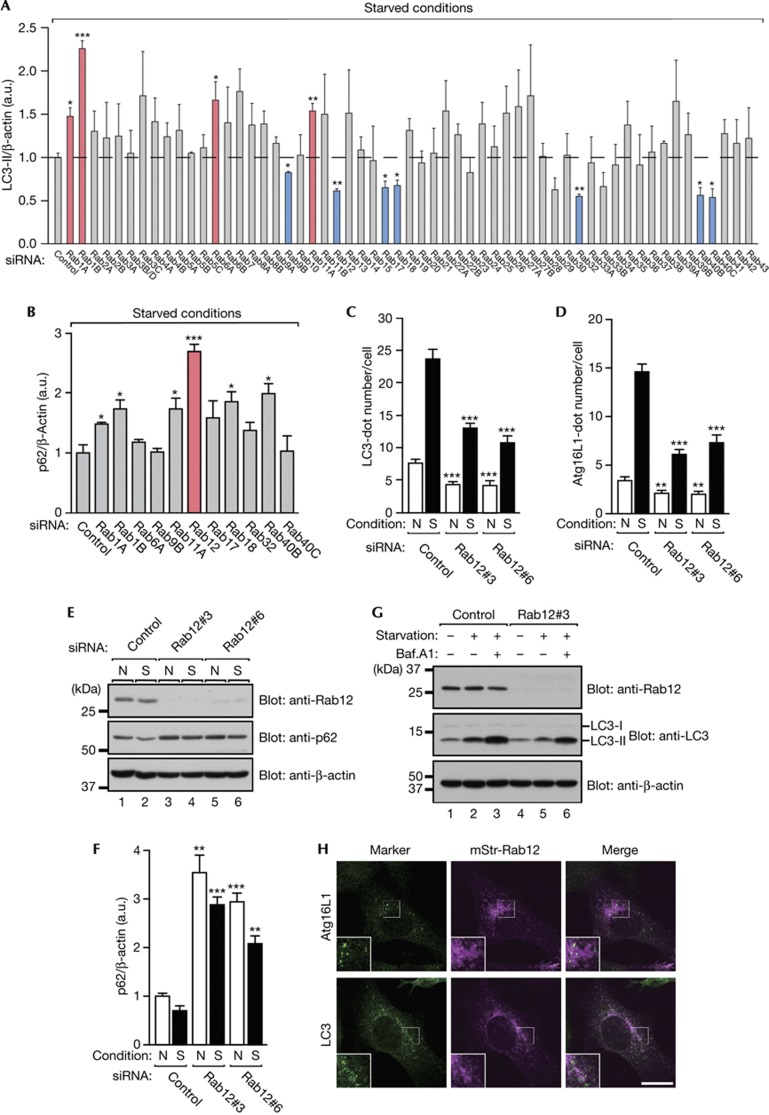
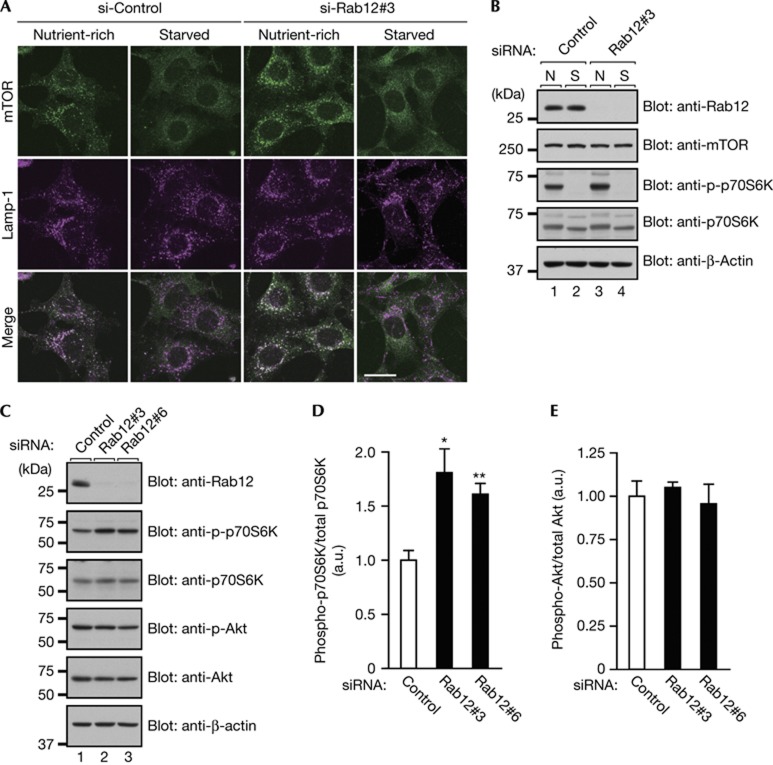
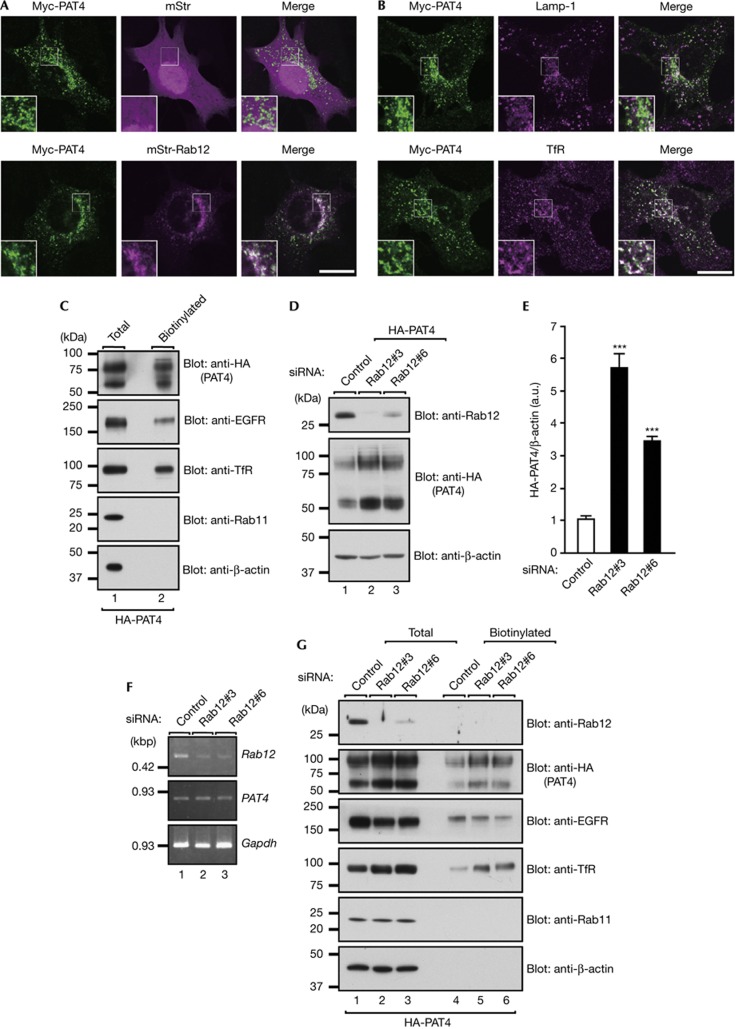
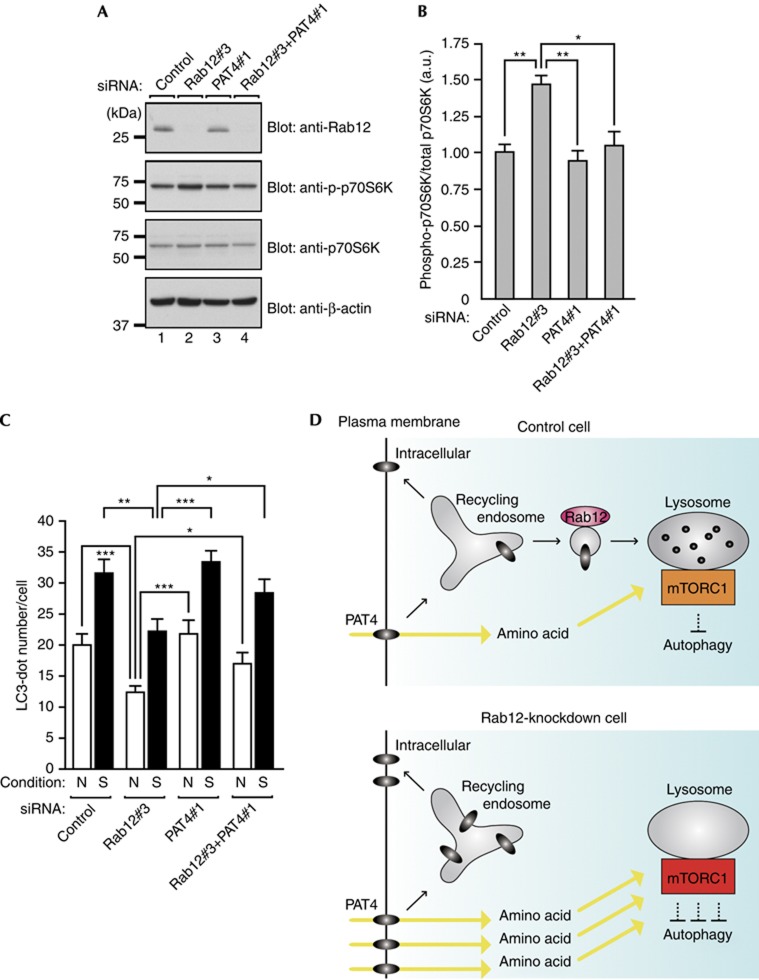
Autophagy is an evolutionarily conserved catabolic mechanism that targets intracellular molecules and damaged organelles to lysosomes. Autophagy is achieved by a series of membrane trafficking events, but their regulatory mechanisms are poorly understood. Here, we report small GTPase Rab12 as a new type of autophagic regulator that controls the degradation of an amino-acid transporter. Knockdown of Rab12 results in inhibition of autophagy and in increased activity of mTORC1 (mammalian/mechanistic target of rapamycin complex 1), an upstream regulator of autophagy. We also found that Rab12 promotes constitutive degradation of PAT4 (proton-coupled amino-acid transporter 4), whose accumulation in Rab12-knockdown cells modulates mTORC1 activity and autophagy. Our findings reveal a new mechanism of regulation of mTORC1 signalling and autophagy, that is, quality control of PAT4 by Rab12.


Conflict of interest statement

The authors declare that they have no conflict of interest.

Figures

Figure 1
Figure 1
Rab12 regulates autophagy. (A) Quantification of the amount of LC3-II protein in mouse Rab-knockdown cells. Representative blots are shown in supplementary Fig S1C online. Error bars represent the means and s.e.m. of three independent experiments. (B) Quantification of the amount of p62 protein in candidates Rab-knockdown cells. Representative blots are shown in supplementary Fig S1D online. Error bars represent the means and s.e.m. of three independent experiments. (C,D) Control and Rab12-knockdown MEFs were cultured under N or S conditions, fixed and then immunostained with the antibodies indicated. Representative images are shown in supplementary Fig S2 online. The mean numbers of LC3-positive (C) or Atg16L1-positive (D) dots per cell are shown. Error bars represent the means and s.e.m. of representative data (n≥80) from three independent experiments. (E) MEFs that had been transfected with the control siRNA or Rab12 siRNA were cultured as in (C,D), and their lysates were analysed by immunoblotting with the antibodies indicated. (F) Quantification of (E). (G) Control and Rab12-knockdown MEFs were cultured under N or S conditions in the absence or presence of 100 μM bafilomycin A1 for 1 h. Cell lysates were analysed by immunoblotting with the antibodies indicated, and the intensity of the LC3-II band was quantified. The normalized amount (arbitrary units) of LC3-II in lanes 1, 2, 3, 4, 5 and 6 is 1.0, 2.3, 4.3, 0.9, 1.6 and 3.8, respectively. (H) MEFs transiently expressing mStr-Rab12 were cultured under starved conditions and immunostained with the antibodies indicated. Scale bar, 20 μm. MEFs, mouse embryonic fibroblasts; N, nutrient-rich; S, starved; siRNA, short interfering RNA. *P<0.05; **P<0.01; ***P<0.005.
Figure 2
Figure 2
Effect of Rab12 knockdown on mTORC1 activity. (A) Control and Rab12-knockdown MEFs were cultured under nutrient-rich or starved conditions, fixed and then immunostained with the antibodies indicated. Scale bar, 20 μm. (B) Control and Rab12-knockdown MEFs were cultured as in (A), and their lysates were analysed by immunoblotting with the antibodies indicated. (C) Lysates of MEFs that had been transfected with control or Rab12 siRNA were analysed by immunoblotting with the antibodies indicated. (D,E) Quantification of the phospho-S6K levels and phospho-Akt levels shown in (C). MEFs, mouse embryonic fibroblasts; N, nutrient-rich; S, starved; siRNA, short interfering RNA. *P<0.05; **P<0.01.
Figure 3
Figure 3
Rab12 regulates constitutive degradation of amino-acid transporter PAT4. (A) MEFs transiently co-expressing Myc-PAT4 and mStr-Rab12 were immunostained with anti-Myc antibody. (B) MEFs transiently expressing Myc-PAT4 were immunostained with the antibodies indicated. Scale bars, 20 μm. (C) Total cell lysates and surface biotinylated proteins from MEFs stably expressing HA-PAT4 were analysed by immunoblotting with the antibodies indicated. (D) Lysates of MEFs stably expressing HA-PAT4 that had been transfected with control or Rab12 siRNAs were analysed by immunoblotting with the antibodies indicated. (E) Quantification of (D). ***P<0.005. (F) PAT4 mRNA levels from MEFs transfected with control or Rab12 siRNA as revealed by reverse-transcription PCR analyses. Gapdh was used as an internal control. (G) Total cell lysates and surface biotinylated proteins from MEFs stably expressing HA-PAT4 that had been transfected with control or Rab12 siRNA were analysed by immunoblotting with the antibodies indicated. Note that the amounts of plasma-membrane-localized PAT4 protein and TfR protein were higher in Rab12-knockdown MEFs, whereas the total amounts of EGFR protein and plasma membrane-localized EGFR protein in these cells were slightly lower, but the mechanisms responsible for these changes are unknown. GAPDH, glyceraldehyde-3-phosphate dehydrogenase; MEFs, mouse embryonic fibroblasts; PAT4, proton-coupled amino-acid transporter 4; siRNA, short interfering RNA.
Figure 4
Figure 4
Rab12 regulates mTORC1 activity and autophagy by controlling the PAT4 protein concentration. (A) Lysates of MEFs transfected with the siRNAs indicated were analysed by immunoblotting with the antibodies indicated. (B) Quantification of the phospho-S6K levels shown in (A). (C) MEFs transfected with the siRNAs indicated were cultured under nutrient-rich (N) or starved (S) conditions and were immunostained with anti-LC3 antibody. The mean numbers of LC3-positive dots per cell are shown. (D) A schematic model of inhibition of autophagy followed by increased activation of mTORC1 in Rab12-depleted cells. MEFs, mouse embryonic fibroblasts; N, nutrient-rich; PAT4, proton-coupled amino-acid transporter 4; S, starved; siRNA, short interfering RNA. *P<0.05; **P<0.01; ***P<0.005.

Comment in

  • On the Rab again--the PATh to mTORC1 activation.
    Gopaldass N, Rompf M, Mayer A. Gopaldass N, et al. EMBO Rep. 2013 May;14(5):398-9. doi: 10.1038/embor.2013.48. Epub 2013 Apr 19. EMBO Rep. 2013. PMID: 23598518 Free PMC article. No abstract available.

References

    1. Mizushima N, Komatsu M (2011) Autophagy: renovation of cells and tissues. Cell 147: 728–741 - PubMed
    1. Mizushima N (2007) Autophagy: process and function. Genes Dev 21: 2861–2873 - PubMed
    1. Stenmark H (2009) Rab GTPases as coordinators of vesicle traffic. Nat Rev Mol Cell Biol 10: 513–525 - PubMed
    1. Fader CM, Sánchez D, Furlán M, Colombo MI (2008) Induction of autophagy promotes fusion of multivesicular bodies with autophagic vacuoles in k562 cells. Traffic 9: 230–250 - PubMed
    1. Longatti A, Lamb CA, Razi M, Yoshimura S, Barr FA, Tooze SA (2012) TBC1D14 regulates autophagosome formation via Rab11- and ULK1-positive recycling endosomes. J Cell Biol 197: 659–675 - PMC - PubMed

Publication types

MeSH terms

Substances