. 2013 May;23(5):749-61.
doi: 10.1101/gr.148718.112. Epub 2013 Mar 11.

The origin, evolution, and functional impact of short insertion-deletion variants identified in 179 human genomes

Affiliations

The origin, evolution, and functional impact of short insertion-deletion variants identified in 179 human genomes

Stephen B Montgomery et al. Genome Res. 2013 May.

Abstract

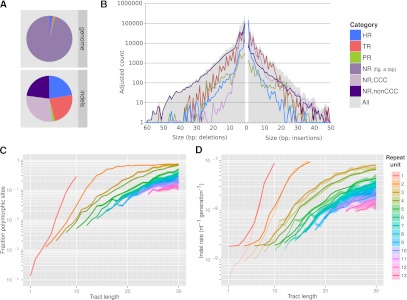
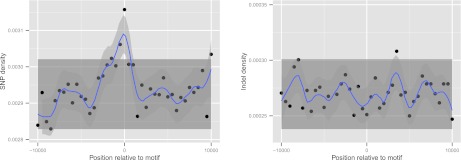
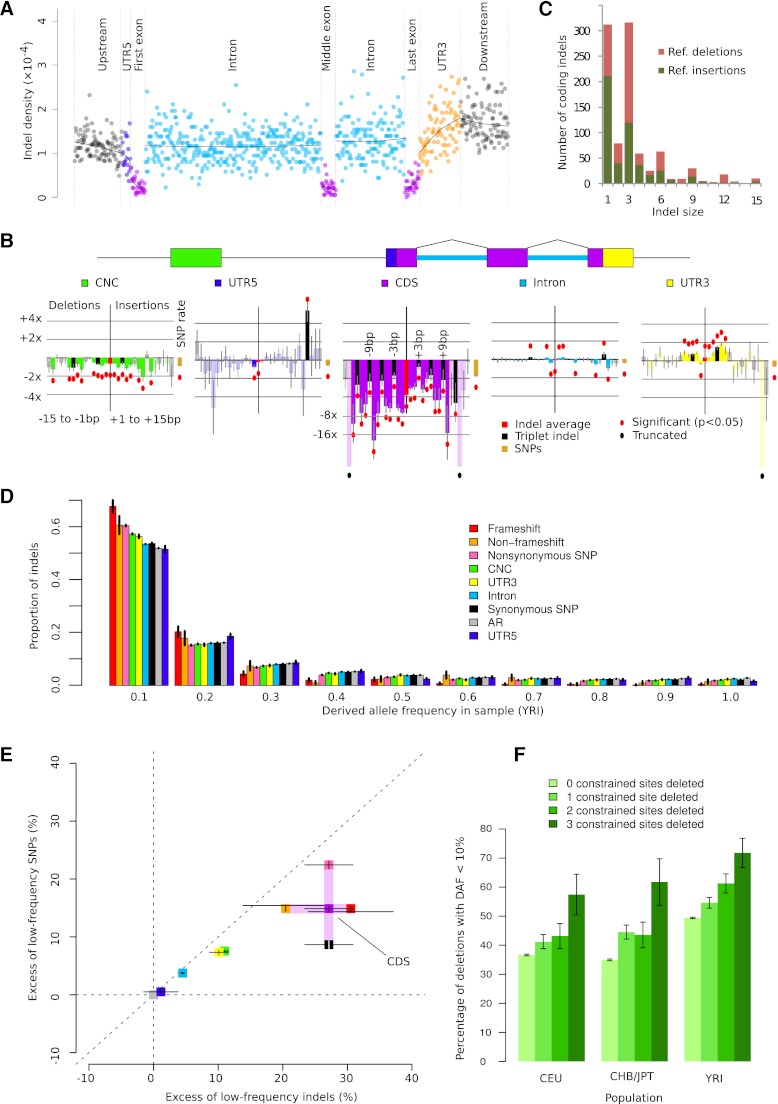
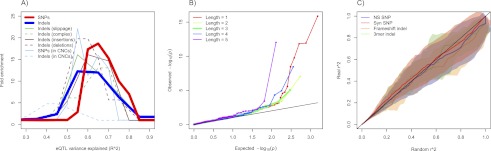
Short insertions and deletions (indels) are the second most abundant form of human genetic variation, but our understanding of their origins and functional effects lags behind that of other types of variants. Using population-scale sequencing, we have identified a high-quality set of 1.6 million indels from 179 individuals representing three diverse human populations. We show that rates of indel mutagenesis are highly heterogeneous, with 43%-48% of indels occurring in 4.03% of the genome, whereas in the remaining 96% their prevalence is 16 times lower than SNPs. Polymerase slippage can explain upwards of three-fourths of all indels, with the remainder being mostly simple deletions in complex sequence. However, insertions do occur and are significantly associated with pseudo-palindromic sequence features compatible with the fork stalling and template switching (FoSTeS) mechanism more commonly associated with large structural variations. We introduce a quantitative model of polymerase slippage, which enables us to identify indel-hypermutagenic protein-coding genes, some of which are associated with recurrent mutations leading to disease. Accounting for mutational rate heterogeneity due to sequence context, we find that indels across functional sequence are generally subject to stronger purifying selection than SNPs. We find that indel length modulates selection strength, and that indels affecting multiple functionally constrained nucleotides undergo stronger purifying selection. We further find that indels are enriched in associations with gene expression and find evidence for a contribution of nonsense-mediated decay. Finally, we show that indels can be integrated in existing genome-wide association studies (GWAS); although we do not find direct evidence that potentially causal protein-coding indels are enriched with associations to known disease-associated SNPs, our findings suggest that the causal variant underlying some of these associations may be indels.


Figures

Figure 1.
Figure 1.
Indels in repetitive sequence contexts. (A) Relative abundance of genomic context classified as repetitive (HR, TR, and PR; see text for definitions) and nonrepetitive (NR) across the genome (top) and among indel sites (bottom). Nonrepetitive indel sites were further divided into copy-number-changing (CCC) and non-CCC indels. (B) Histogram of insertion (right) and deletion (left) counts by variant length (solid gray), and separately by genomic context (superimposed lines). Counts were adjusted within each context category to account for the fraction of polarizable calls. (C,D) Fraction of polymorphic repeat tracts (C) and relative per-nucleotide indel rates (thin lines) and model fit (D), by length of tandem repeat unit (color) and tract length (horizontal axis). Shading indicates ±2 standard errors of the mean observed polymorphic fraction or indel rate.
Figure 2.
Figure 2.
Enrichment for SNPs but not indels in recombination hotspots. Density of SNPs (left) and indels (right) in the CEU cohort in 500-bp bins across 20 kb centered around the motif CCTCCCTNNCCAC, associated with recombination hotspots. The shaded rectangle denotes two SEM and was obtained from observations excluding the central three bins; the blue curve and 95% confidence band was obtained by loess smoothing with parameter α = 0.2.
Figure 3.
Figure 3.
Purifying selection against indels in functional regions. (A) Aggregate indel density (the sum of all indels in a set of bins divided by the total length of those bins) in six genic regions (GENCODE version 3b). (B) Relative indel rates by length (negative x-axis, deletions; positive x-axis, insertions) and annotation (color-coded), controlling for background rates influenced by sequence composition. Bars represent log relative excess or depletion compared to the background rate; red dots mark bars that are significant at the 5% level, not corrected for multiple testing. (C) Histogram of coding indel lengths; colors indicate (unpolarized, reference) deletions and insertions. (D) Derived allele frequency (DAF) distribution of deletions by annotation category. (E) Relative excess of low-DAF (<10%) indels and SNPs by annotation class, calculated as (NiNn)/Nn × 100%, where Ni is the fraction of low-DAF variants in element i, and Nn is the fraction of low-DAF variants in ancestral repeats. (F) Fraction of low-DAF (<10%) 3-bp deletions by number of constrained sites deleted (χ2 P < 5 × 10⁻³ in all populations). All error bars (B,D,E,F) represent 1 SEM.
Figure 4.
Figure 4.
Indels influencing gene expression and disease. (A) Distribution of relative frequencies (y-axis) with which variants drawn from several classes (see legend) explain a certain fraction of the variance in exonic gene expression levels (x-axis, measured by R2, Pearson's correlation coefficient squared). For each variant, the exon showing the highest association was taken. Frequencies are shown relative to the distribution obtained from 100 permutations (for details, see Supplemental Information). (B) QQ plots of Spearman association P-values for coding indels by exon-level gene expression are stratified by indel length. Here, the enrichment of P-values for indels of length 1, 2, 4, and 5 relative to length 3 (green-line) is indicative of nonsense-mediated decay. For associations at an FDR of 0.20, this difference trended to significance for polarized indels (P = 0.10) and was significant for polarized and slippage indels (P = 0.04). (C) QQ plots of the distribution of linkage (r2) between GWA variants and nearby protein-coding variants (y-axis; four classes of variants), against a background distribution obtained from randomly drawn SNPs chosen to be controlled for excess linkage, and frequency-matched and chromosome-matched with the set of GWA SNPs (x-axis) (Supplemental Information). The central line and standard errors of these QQ curves were obtained by repeating the procedure 100 times. The SNP and indel r2 distributions and standard errors (displayed as a cloud) tracked each other across all observed values.

References

    1. The 1000 Genomes Project Consortium. 2010. A map of human genome variation from population-scale sequencing. Nature 467: 1061–1073 - PMC - PubMed
    1. Akashi H, Schaeffer SW 1997. Natural selection and the frequency distributions of “silent” DNA polymorphism in Drosophila. Genetics 146: 295–307 - PMC - PubMed
    1. Albers CA, Lunter G, MacArthur DG, McVean G, Ouwehand WH, Durbin R 2011. Dindel: Accurate indel calls from short-read data. Genome Res 21: 961–973 - PMC - PubMed
    1. Ananda G, Walsh E, Jacob KD, Krasilnikova M, Eckert KA, Chiaromonte F, Makova KD 2013. Distinct mutational behaviors differentiate short tandem repeats from microsatellites in the human genome. Genome Biol Evol (in press). - PMC - PubMed
    1. Bhangale TR, Rieder MJ, Livingston RJ, Nickerson DA 2005. Comprehensive identification and characterization of diallelic insertion-deletion polymorphisms in 330 human candidate genes. Hum Mol Genet 14: 59–69 - PubMed

Publication types

LinkOut - more resources