. 2013 Apr;123(4):1605-14.
doi: 10.1172/JCI65153. Epub 2013 Mar 8.

Increased brain uptake and oxidation of acetate in heavy drinkers

Affiliations

Increased brain uptake and oxidation of acetate in heavy drinkers

Lihong Jiang et al. J Clin Invest. 2013 Apr.

Abstract

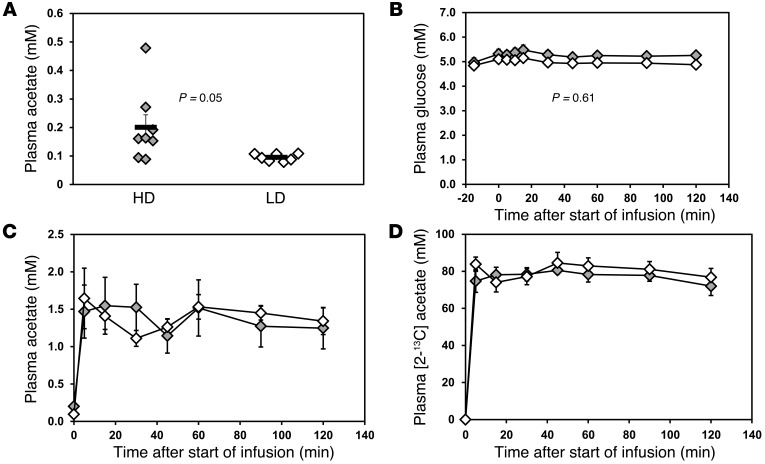
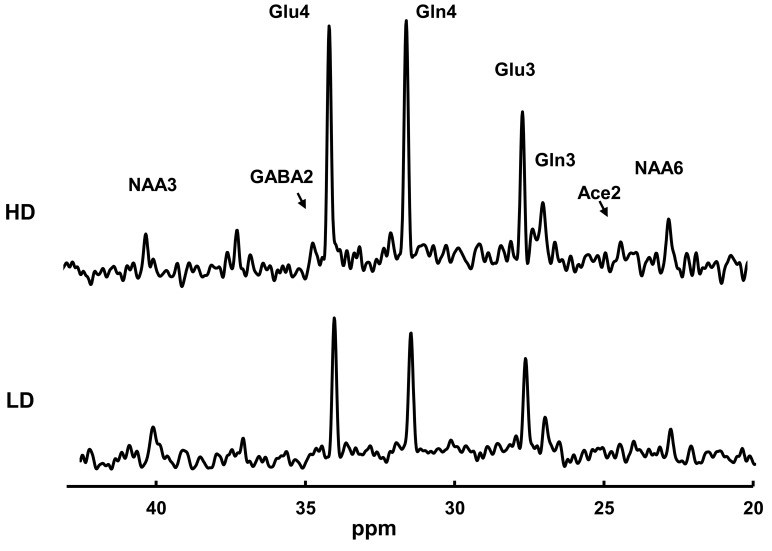
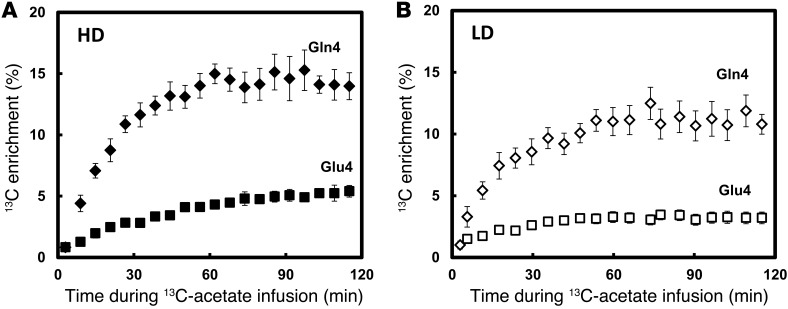
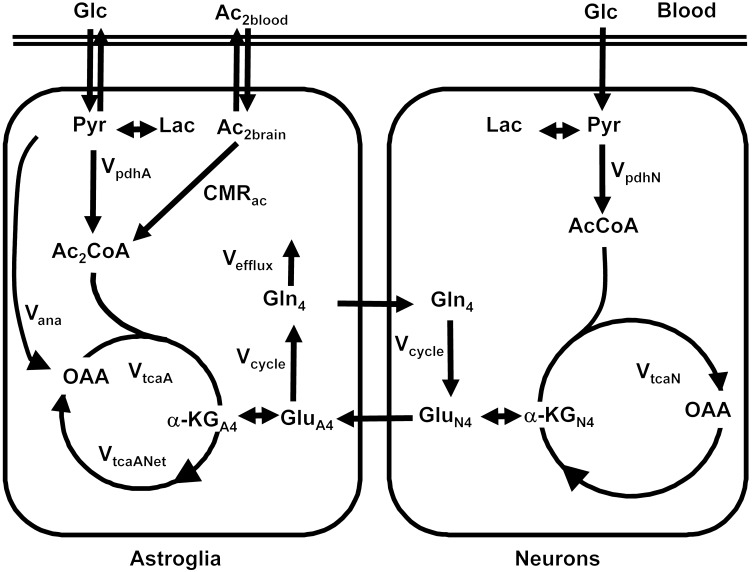
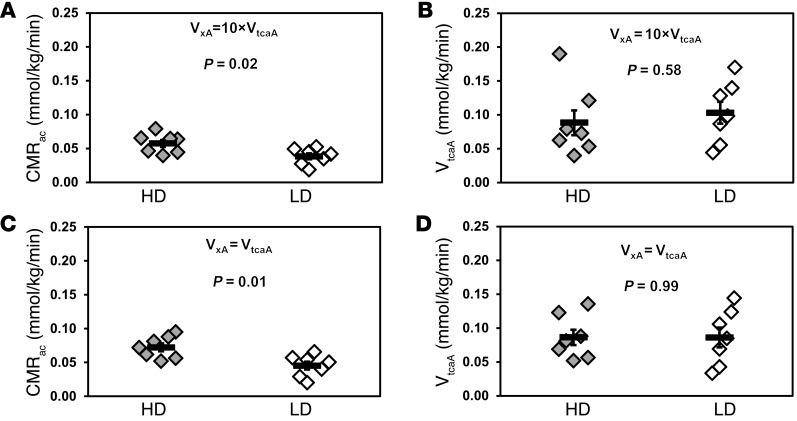
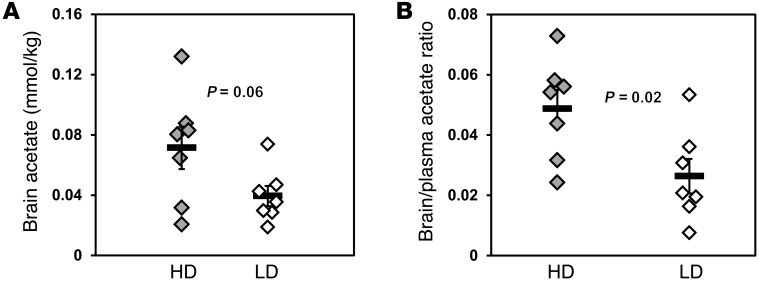
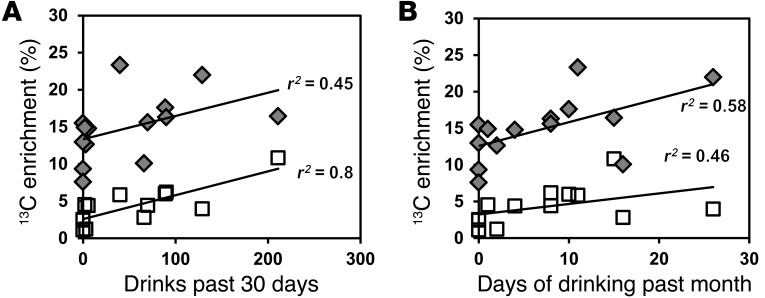
When a person consumes ethanol, the body quickly begins to convert it to acetic acid, which circulates in the blood and can serve as a source of energy for the brain and other organs. This study used 13C magnetic resonance spectroscopy to test whether chronic heavy drinking is associated with greater brain uptake and oxidation of acetic acid, providing a potential metabolic reward or adenosinergic effect as a consequence of drinking. Seven heavy drinkers, who regularly consumed at least 8 drinks per week and at least 4 drinks per day at least once per week, and 7 light drinkers, who consumed fewer than 2 drinks per week were recruited. The subjects were administered [2-13C]acetate for 2 hours and scanned throughout that time with magnetic resonance spectroscopy of the brain to observe natural 13C abundance of N-acetylaspartate (NAA) and the appearance of 13C-labeled glutamate, glutamine, and acetate. Heavy drinkers had approximately 2-fold more brain acetate relative to blood and twice as much labeled glutamate and glutamine. The results show that acetate transport and oxidation are faster in heavy drinkers compared with that in light drinkers. Our finding suggests that a new therapeutic approach to supply acetate during alcohol detoxification may be beneficial.


Figures

Figure 1
Figure 1. Plasma acetate and glucose concentrations during [2-13C]acetate infusion.
(A) Plasma acetate concentrations before infusion. Symbols represent individual concentrations; horizontal bars indicate the mean. (B) Averaged plasma glucose concentrations during acetate infusion. (C) Averaged plasma acetate concentrations during [2-13C]acetate infusion. (D) Averaged plasma acetate 13C enrichments during the acetate infusion. Gray diamonds represent heavy drinkers (HD), and white diamonds represent light drinkers (LD). Values with error bars represent mean ± SEM.
Figure 2
Figure 2. Steady-state 13C-spectra of a heavy drinker (top spectrum) and a light drinker (lower spectrum).
The heavy drinker had markedly greater 13C labeling than the light drinker. Acquisition parameters were as follows: 765 complex points; 5,000 Hz bandwidth; repetition time, 2.5 seconds. A total of 640 acquisitions were grouped to make each spectrum, each representing the final 27 minutes observed while the glutamate and glutamine C4 labeling were at a steady state. The spectra were zero filled to 16,384 complex points, windowed with –2 Hz Lorentzian and 6 Hz Gaussian broadening, and Fourier transformed.
Figure 3
Figure 3. Averaged time courses of the percentage of 13C enrichment of Glu4 and Gln4 for (A) heavy drinkers and (B) light drinkers.
Heavy drinkers showed higher 13C labeling in both Glu4 and Gln4, consistent with greater utilization of acetate. Gln4 is represented by black diamonds and Glu4 is represented by black squares in heavy drinkers. Gln4 is represented by white diamonds and Glu4 is represented by white squares in light drinkers. Values with error bars represent group mean ± SEM.
Figure 4
Figure 4. Metabolic pathways showing brain uptake of [2-13C]acetate and transfer of the 13C labeling to glutamine and glutamate in astroglia and neurons.
Astroglia consume acetate, while neurons and astroglia both consume glucose (Glc). The acetate labeled at the methyl group, whose carbon is designated 2 (Ac2), enters the astroglia and the TCA cycle to form C2-labeled acetyl CoA (Ac2CoA). In the first turn of the Krebs cycle, it labels the C4 of astroglial α-ketoglutarate (α-KGA4), which exchanges to form glutamate C4 (GluA4). Astroglia convert glutamate to glutamine, forming glutamine C4 (Gln4), which is transferred to neurons, converted, and mixed with the large neuronal pool of glutamate (GluN4). Some of the glutamate is released as part of glutamate-glutamine cycling, and some exchanges to form neuronal α-ketoglutarate (α-KGN4). In both compartments, the carbon continues through the cycle and labels oxaloacetate (OAA) and labels glutamate and glutamine at C3 (data not shown) but does not return to the C4 of glutamate and glutamine. Meanwhile, the vast majority of glucose remains unlabeled and dilutes the pool of acetyl CoA and the Krebs cycle intermediates in neurons and astroglia. AcCoA, acetyl-CoA; Lac, lactate; Pyr, pyruvate.
Figure 5
Figure 5. Metabolic rates calculated based on individual 13C time courses of Glu4 and Gln4 and the steady state of Glu3 and Gln3.
The value of VxA, which is the rate of exchange between astroglial α-ketoglutarate and glutamate, has not been determined. The kinetics was therefore tested over a range of values of VxA. Its minimum possible value is equal to the rate of the TCA cycle VtcaA, and, for values above 10×VtcaA, there is negligible difference in the kinetic impact compared with infinity (70), so VxA = 10×VtcaA was selected as the maximum of the range. (A) CMRac was calculated assuming VxA= 10×VtcaA. CMRac was significantly greater in the heavy drinking group (P = 0.02). (B) Astroglial TCA cycle (VtcaA) rates did not differ (P = 0.58) when VxA= 10×VtcaA. (C) CMRac was calculated assuming VxA = VtcaA, showing significant differences between heavy drinkers and light drinkers (P = 0.01). (D) VtcaA showed no difference between heavy drinker and light drinker groups when VxA = VtcaA (P = 0.99). Values with error bars represent group mean ± SEM. Symbols represent individual concentrations; horizontal bars indicate the mean.
Figure 6
Figure 6. Brain acetate concentrations during steady-state [2-13C]acetate infusion, showing heavy drinkers have increased [2-13C]acetate in brain.
(A) Steady-state brain [2-13C] acetate concentrations during the [2-13C]acetate infusion. (B) Ratios of brain/blood acetate concentrations at steady-state [2-13C]acetate infusion. Values with error bars represent group average ± SEM. Symbols represent individual concentrations; horizontal bars indicate the mean.
Figure 7
Figure 7. Correlations between glutamate C4 and glutamine C4 enrichments and recent drinking history for both heavy drinkers and light drinkers.
(A) Correlation with drinks in the past 30 days for Glu4 (P = 0.0005) and Gln4 (P = 0.1). (B) Correlation with days of drinking in the past month for Glu4 (P = 0.098) and Gln4 (P = 0.03). Gray diamonds represent Gln4 13C enrichments, and white squares represent Glu4 13C enrichments.

Similar articles

Cited by

References

    1. Prosser RA, Mangrum CA, Glass JD. Acute ethanol modulates glutamatergic and serotonergic phase shifts of the mouse circadian clock in vitro. Neuroscience. 2008;152(3):837–848. doi: 10.1016/j.neuroscience.2007.12.049. - DOI - PMC - PubMed
    1. Wallner M, Hanchar HJ, Olsen RW. Low-dose alcohol actions on alpha4beta3delta GABAA receptors are reversed by the behavioral alcohol antagonist Ro15-4513. Proc Natl Acad Sci U S A. 2006;103(22):8540–8545. doi: 10.1073/pnas.0600194103. - DOI - PMC - PubMed
    1. Wakita M, Shin MC, Iwata S, Nonaka K, Akaike N. Effects of ethanol on GABAA receptors in GABAergic and glutamatergic presynaptic nerve terminals. J Pharmacol Exp Ther. 2012;341(3):809–819. doi: 10.1124/jpet.111.189126. - DOI - PubMed
    1. Ting JW, Lautt WW. The effect of acute, chronic, and prenatal ethanol exposure on insulin sensitivity. Pharmacol Ther. 2006;111(2):346–373. doi: 10.1016/j.pharmthera.2005.10.004. - DOI - PubMed
    1. Manzo-Avalos S, Saavedra-Molina A. Cellular and mitochondrial effects of alcohol consumption. Int J Environ Res Public Health. 2010;7(12):4281–4304. doi: 10.3390/ijerph7124281. - DOI - PMC - PubMed

Publication types