. 2013:3:1431.
doi: 10.1038/srep01431.

Malaria pigment crystals as magnetic micro-rotors: key for high-sensitivity diagnosis

Affiliations

Malaria pigment crystals as magnetic micro-rotors: key for high-sensitivity diagnosis

A Butykai et al. Sci Rep. 2013.

Abstract

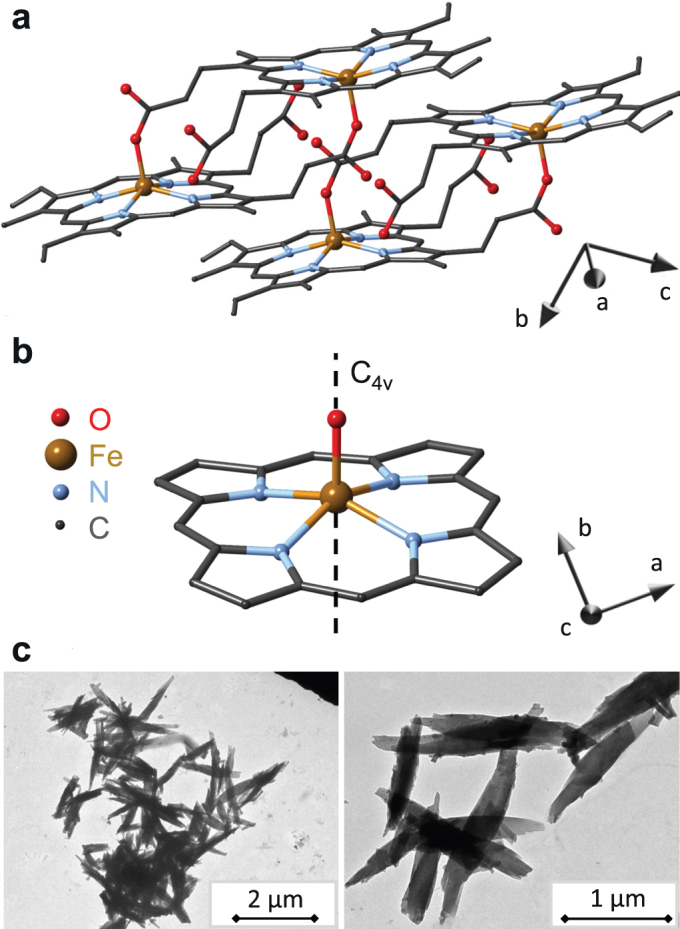
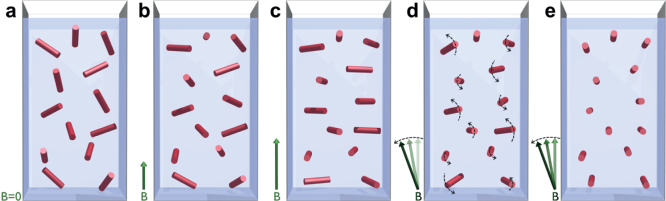
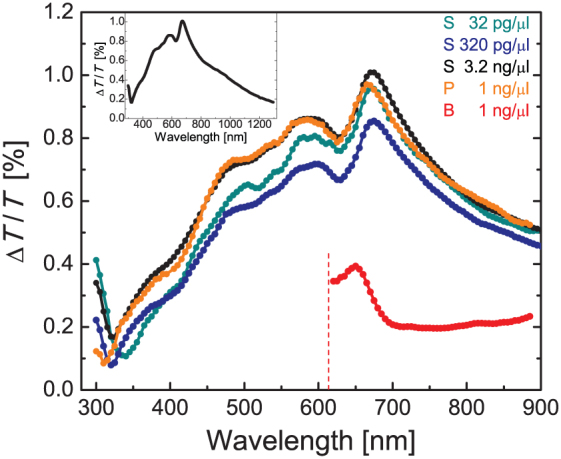
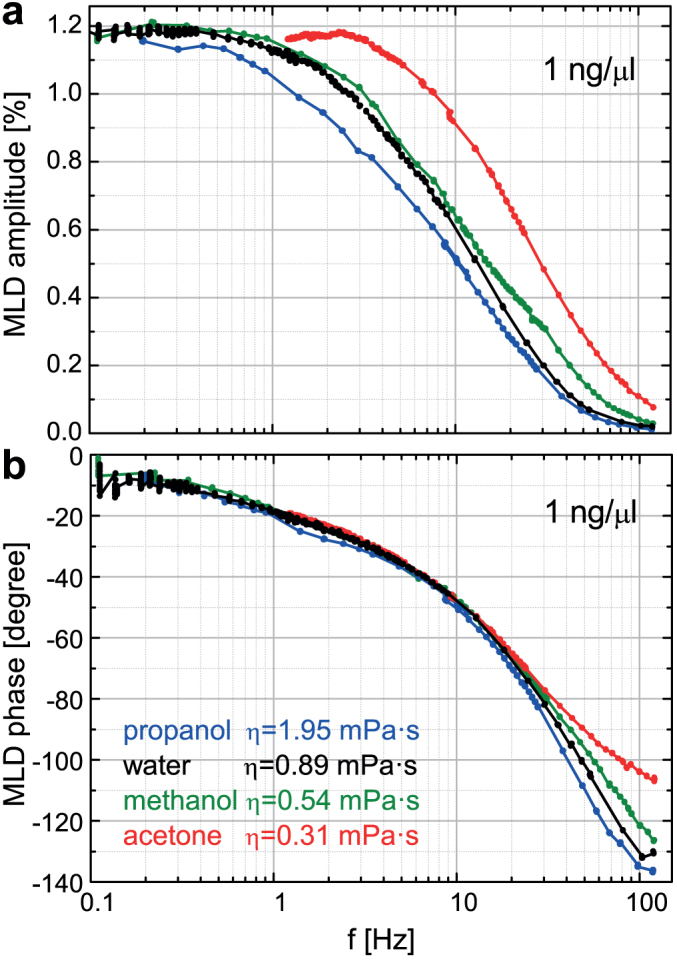
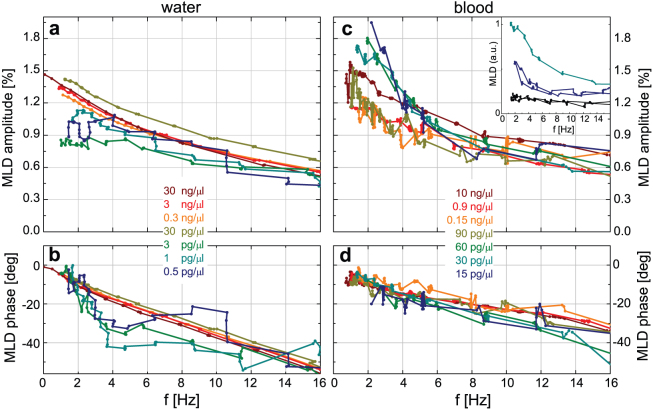
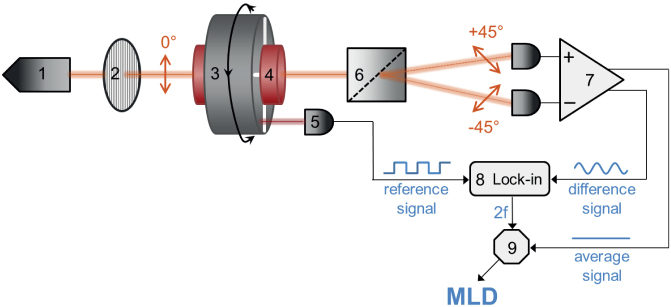
The need to develop new methods for the high-sensitivity diagnosis of malaria has initiated a global activity in medical and interdisciplinary sciences. Most of the diverse variety of emerging techniques are based on research-grade instruments, sophisticated reagent-based assays or rely on expertise. Here, we suggest an alternative optical methodology with an easy-to-use and cost-effective instrumentation based on unique properties of malaria pigment reported previously and determined quantitatively in the present study. Malaria pigment, also called hemozoin, is an insoluble microcrystalline form of heme. These crystallites show remarkable magnetic and optical anisotropy distinctly from any other components of blood. As a consequence, they can simultaneously act as magnetically driven micro-rotors and spinning polarizers in suspensions. These properties can gain importance not only in malaria diagnosis and therapies, where hemozoin is considered as drug target or immune modulator, but also in the magnetic manipulation of cells and tissues on the microscopic scale.


Figures

Figure 1
Figure 1. Structure and morphology of hemozoin crystals.
(a) Triclinic structure of hemozoin with two unit cells displayed using structural data from Ref. . The main crystallographic axes a, b and c are also indicated. (b) The local symmetry of five-fold coordinated iron in hemozoin nearly preserves a four-fold rotation axis, C4v. The angle spanned by this C4v axis (hard axis of the magnetization) and the crystallographic c-axis (fore-axis of the elongated crystals) is δ ≈ 60°, where the c-axis points out of the plane of the figure. (c) Transmission electron micrographs of typical hemozoin crystallites dried from suspensions.
Figure 2
Figure 2. Magnetic orientation and dynamics of paramagnetic hemozoin crystals with anisotropic easy-plane character.
In these schematic drawings, the cylinders represent the suspended hemozoin crystals. The axes of the cylinders correspond to the magnetic hard axes of the crystals and not related to their fore-axes. (a) Without external magnetic field the crystals in the suspension are randomly oriented. (b) With the application of a magnetic field, the hard axes of the crystals begin to align perpendicular to the magnetic field vector B, though this orientation is hindered by the thermal fluctuations. (c) In the high-field limit this two-dimensional alignment is completed, with the hard axis of each crystal lying within the plane normal to the field. (d) In slowly rotating fields the crystallites behave as magnetically driven micro-rotors. (e) Due to the viscosity of the fluid, at high rotation frequencies their hard axes tend to align parallel to the rotation axis and consequently they stop spinning. Only in this case a full three dimensional alignment of the hard axes is achieved.
Figure 3
Figure 3. Magnetization anisotropy of malaria pigment crystals.
(a) Field dependence of the magnetization measured at T = 2 K for a powder sample, randomly oriented (zero-field cooled suspension) crystals and magnetically aligned (field cooled suspension) crystals are shown by blue open circles, blue dots and green dots, respectively. As expected, the former two are essentially identical. Magnetization curves calculated for fields lying within the easy plane and pointing along the hard axis of a crystal are also plotted with green and red lines, respectively. The angular average of the magnetization corresponding to the random orientation of the crystals is also displayed with blue line. (For details of the calculation see the Methods section.) Magnetization values are given for a single iron site in Bohr-magneton units. To emphasize the anisotropic character of hemozoin, Brillouin's function describing the magnetization of an isotropic S = 5/2 spin is also shown (dashed grey line). (b) Low-field magnetization of hemozoin as a function of the inverse temperature measured in B = 0.5 T. The position of 300 K and 5 K are indicated on the upper scale. The inset shows the data on a linear temperature scale around 300 K. Symbols and lines indicate respectively the same measured and calculated quantities as in panel (a).
Figure 4
Figure 4. Magnetically induced linear dichroism in hemozoin suspensions.
Magnetic field dependence of linear dichroism measured on a room-temperature aqueous suspension of hemozoin at wavelengths λ = 475 nm (blue squares), 585 nm (orange triangles) and 670 nm (red dots). Data corresponding to different wavelengths were normalized to a common scale, which resulted in a universal field dependence reproduced well by the theory. Assuming an average-sized crystal, the fitting (dotted line) yields Mx/Mz = 1.11 for the magnetization anisotropy, which corresponds to MxMz = 0.013 μB/Fe in a magnetic field of 5 T. The quality of the fit can be further improved (solid line) by assuming the distribution of crystal size shown in the inset. For details see the main text.
Figure 5
Figure 5. Wavelength dependence of the MLD effect in hemozoin suspensions.
MLD spectra for room-temperature hemozin suspensions in normal saline (S), blood plasma (P) and full blood (B) normalized to a concentration of 1 ng/μl. The inset shows the MLD effect over a broader spectral range in normal saline.
Figure 6
Figure 6. Magnetically driven dynamics of hemozoin crystals in various suspension media at room temperature.
(a)/(b) Semi-logarithmic plot of MLD amplitude/phase versus the frequency of the field rotation, f, for hemozoin suspended in propanol, water, methanol and acetone with 1 ng/μl concentration. Results in hemolyzed blood are essentially identical with those obtained in water and not shown here. Viscosity (η) for the different media are also indicated.
Figure 7
Figure 7. Sensitivity of the optical diagnostic method based on the magnetic rotation of hemozoin crystals in water and blood.
(a)/(b) MLD amplitude/phase for hemozoin in water over a limited frequency range optimal in sense of signal to noise ratio. (c)/(d) MLD amplitude/phase for hemozoin in blood over the same frequency range. The concentration of hemozoin varies over five and three orders of magnitude in water and blood, respectively. The amplitude of the MLD signal is normalized to 1 ng/μl hemozoin content. Concentrations of blood samples refer to the hemozoin contents in full blood and not in hemolyzed blood. The concentration levels of 0.5 pg/μl and 15 pg/μl are still readily detectable in water and blood, respectively. Inset in panel (c) shows the reproducibility for the baseline (black curves) and the lowest-concentration data (with color coding used in the main panel).
Figure 8
Figure 8. Flowchart of the diagnostic setup.
The beam from the laser diode (1) passes through a polarizer (2) and becomes vertically polarized. Then it goes through the sample holder (4) located in the bore of the Halbach magnet (3). The magnet is rotated with a frequency f by a d.c. motor, thus, the uniform magnetic field of B ≈ 1 T at the sample position rotates within the plane perpendicular to the light propagation. After the sample, the beam is divided into two parts with orthogonal polarizations (±45°) by a Rochon prism (6). The difference and the average of their intensities are detected by a balanced photodiode bridge (7). The 2f component of the difference signal is filtered out by a lock-in amplifier (8) using the reference signal from an optoswitch (5) monitoring the rotation of the magnet. To obtain the MLD signal, the amplitude of the second harmonic (2f) signal is normalized with the average signal by a divisor (9).

References

    1. World malaria report 2011, December 13, 2011. (http://www.who.int/malaria).
    1. Greenwood B. M., Bojang K., Whitty C. J. & Targett G. A. Malaria. Lancet 365, 1487–1498 (2005). - PubMed
    1. Yuan J. et al. Chemical genomic profiling for antimalarial therapies, response signatures, and molecular targets. Science 333, 724–729 (2011). - PMC - PubMed
    1. Bell D., Wongsrichanalai C. & Barnwell J. W. Ensuring quality and access for malaria diagnosis: how can it be achieved? Nat. Rev. Microbiol. 4, 682–695 (2006). - PubMed
    1. Moody A. Rapid diagnostic tests for malaria parasites. Clin. Microbiol. Rev. 15, 66–78 (2002). - PMC - PubMed

Publication types