

Advantages of full spectrum flow cytometry
- PMID: 23478809
- PMCID: PMC3592788
- DOI: 10.1117/1.JBO.18.3.037004
Advantages of full spectrum flow cytometry
Abstract
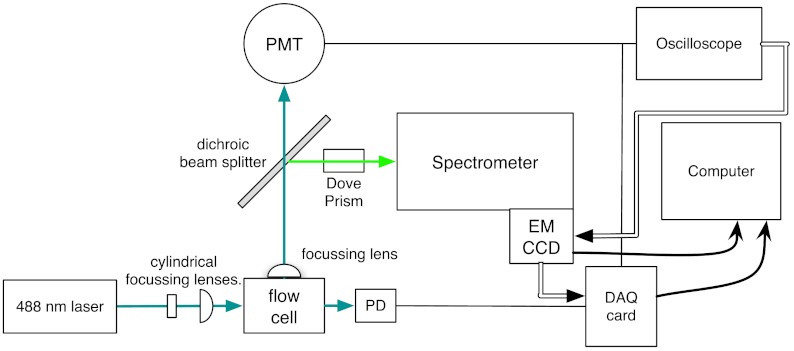
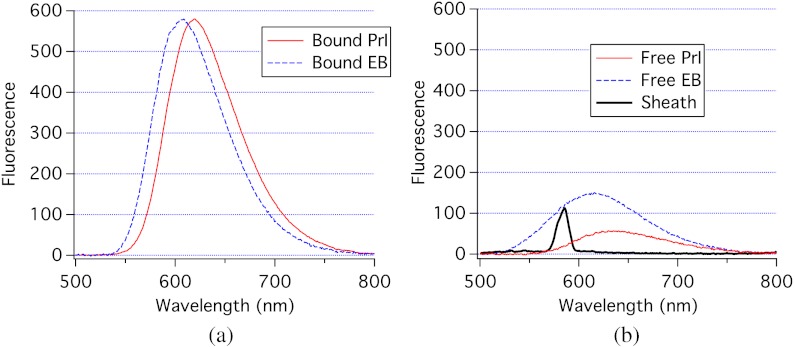
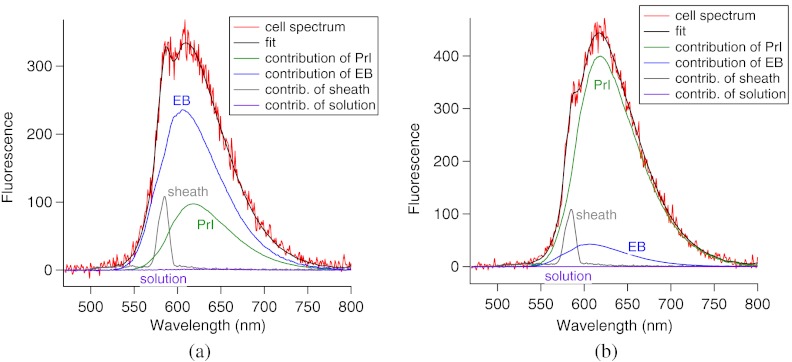
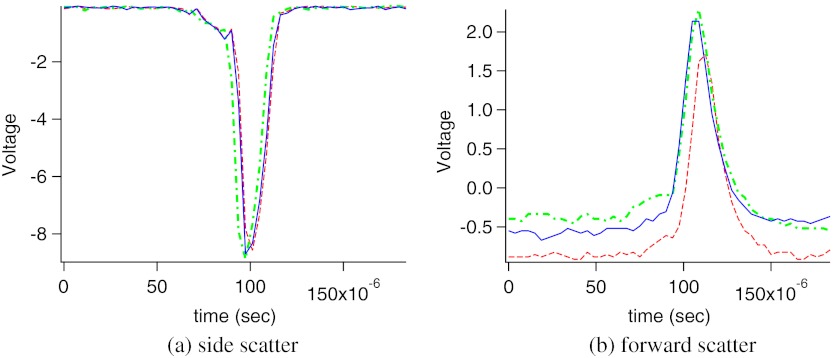
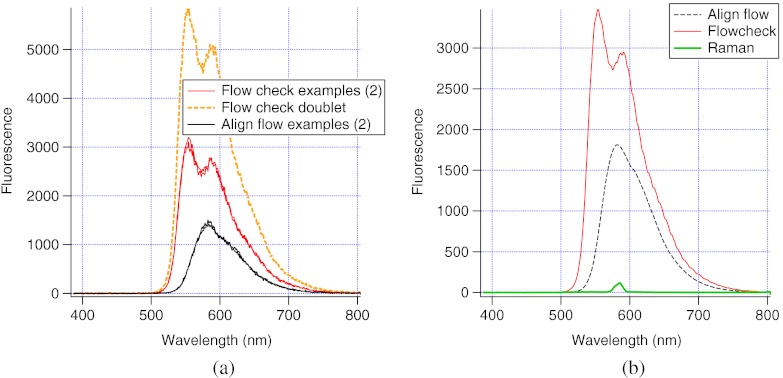
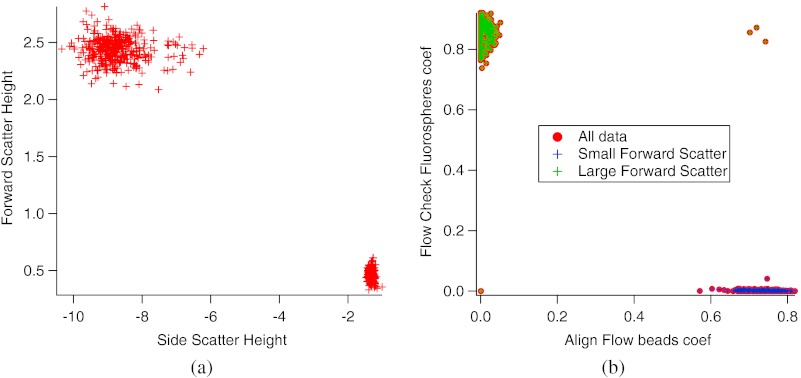
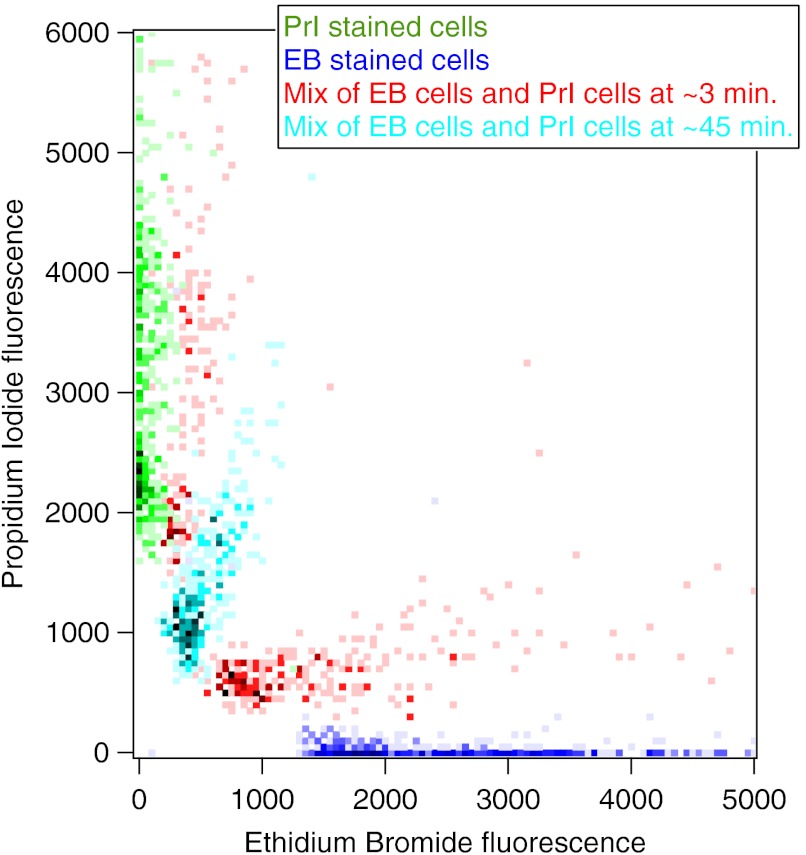
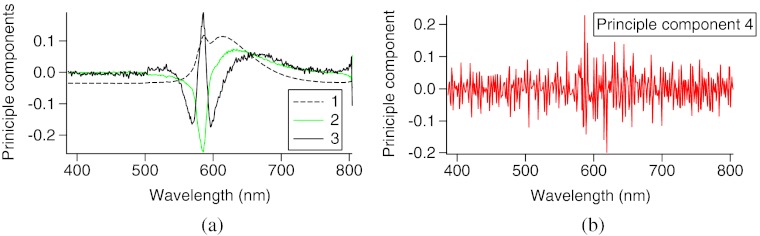
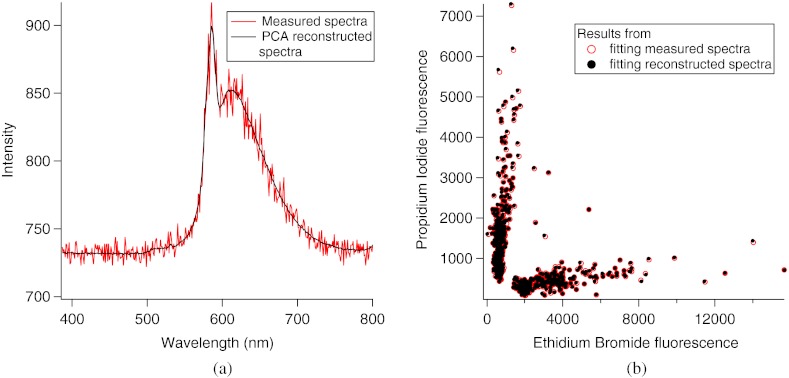
A charge coupled device-based flow-cytometer for the measurement of full spectra was implemented and characterized. The spectral resolution was better than 1.5 nm and the coefficient of variation for fluorescence from flow check beads was 5% or better. Both cell and bead data were analyzed by fitting to measured component spectra. Separation of flow check and align flow beads, which have similar spectra, was nearly identical whether using a spectral analysis or a scatter analysis. After mixing, cells stained with ethidium bromide or propidium iodide were measured at different timepoints. The contribution of these 12 nm separated emission spectra could be separately quantified and the kinetic process of the samples becoming homogeneous due to fluorophor dissociation and rebinding was observed. Principle component analysis was used to reduce noise and alternating least squares (ALS) was used to analyze one set of noise-reduced cell data without knowledge of the component spectra. The component spectra obtained via ALS are very similar to the measured component spectra. The contributions of ethidium bromide and propidium iodide to the individual spectra are also similar to those obtained via the spectral fitting procedure.
Figures

Similar articles
-
Flow cytometric discrimination of mitotic cells: resolution of M, as well as G1, S, and G2 phase nuclei with mithramycin, propidium iodide, and ethidium bromide after fixation with formaldehyde.Cytometry. 1986 Jan;7(1):54-63. doi: 10.1002/cyto.990070108. Cytometry. 1986. PMID: 2419056
-
Fluorescence spectra of DNA dyes measured in a flow cytometer.Cytometry. 1996 Jul 1;24(3):234-42. doi: 10.1002/(SICI)1097-0320(19960701)24:3<234::AID-CYTO6>3.0.CO;2-H. Cytometry. 1996. PMID: 8800556
-
Phase-resolved fluorescence lifetime measurements for flow cytometry.Cytometry. 1993;14(2):123-35. doi: 10.1002/cyto.990140204. Cytometry. 1993. PMID: 8440147
-
Development of Spectral Imaging Cytometry.Methods Mol Biol. 2023;2635:3-22. doi: 10.1007/978-1-0716-3020-4_1. Methods Mol Biol. 2023. PMID: 37074654 Review.
-
Spectral flow cytometry.Curr Protoc Cytom. 2013 Jan;Chapter 1:1.27.1-1.27.13. doi: 10.1002/0471142956.cy0127s63. Curr Protoc Cytom. 2013. PMID: 23292705 Free PMC article. Review.
Cited by
-
Using Virtual Filtering Approach to Discriminate Microalgae by Spectral Flow Cytometer.Methods Mol Biol. 2023;2635:23-40. doi: 10.1007/978-1-0716-3020-4_2. Methods Mol Biol. 2023. PMID: 37074655
-
Advanced immunophenotyping: A powerful tool for immune profiling, drug screening, and a personalized treatment approach.Front Immunol. 2023 Mar 24;14:1096096. doi: 10.3389/fimmu.2023.1096096. eCollection 2023. Front Immunol. 2023. PMID: 37033944 Free PMC article.
-
Flow Cytometry Detection of Anthracycline-Treated Breast Cancer Cells: An Optimized Protocol.Curr Issues Mol Biol. 2022 Dec 28;45(1):164-174. doi: 10.3390/cimb45010013. Curr Issues Mol Biol. 2022. PMID: 36661499 Free PMC article.
-
Full spectrum flow cytometry and mass cytometry: A 32-marker panel comparison.Cytometry A. 2022 Nov;101(11):942-959. doi: 10.1002/cyto.a.24565. Epub 2022 May 20. Cytometry A. 2022. PMID: 35593221 Free PMC article.
-
T Lymphocytes and Testicular Immunity: A New Insight into Immune Regulation in Testes.Int J Mol Sci. 2020 Dec 23;22(1):57. doi: 10.3390/ijms22010057. Int J Mol Sci. 2020. PMID: 33374605 Free PMC article. Review.
References
-
- de Juan A., Tauler R., “Chemometrics applied to unravel multicomponent processes and mixtures revisiting latest trends in multivariate resolution,” Anal. Chim. Acta 500(1–2), 195–210 (2003).ACACAM10.1016/S0003-2670(03)00724-4 - DOI
Publication types
MeSH terms
Substances
Grants and funding
LinkOut - more resources
Full Text Sources
Other Literature Sources
Miscellaneous
