. 2013 Nov;112(8):1613-28.
doi: 10.1093/aob/mct027. Epub 2013 Mar 10.

Macroevolution of panicoid inflorescences: a history of contingency and order of trait acquisition

Affiliations

Macroevolution of panicoid inflorescences: a history of contingency and order of trait acquisition

R Reinheimer et al. Ann Bot. 2013 Nov.

Abstract

Background and aims: Inflorescence forms of panicoid grasses (Panicoideae s.s.) are remarkably diverse and they look very labile to human eyes; however, when performing a close inspection one can identify just a small subset of inflorescence types among a huge morphospace of possibilities. Consequently, some evolutionary constraints have restricted, to some extent, the diversification of their inflorescence. Developmental and genetic mechanisms, the photosynthetic type and plant longevity have been postulated as candidate constraints for angiosperms and panicoids in particular; however, it is not clear how these factors operate and which of these have played a key role during the grass inflorescence evolution. To gain insight into this matter the macroevolutionary aspects of panicoid inflorescences are investigated.

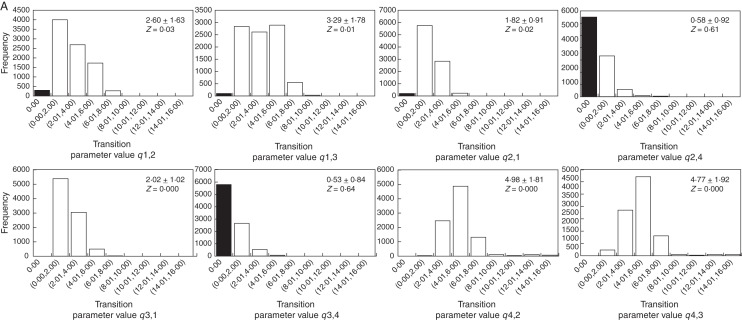
Methods: The inflorescence aspect (lax versus condensed), homogenization, truncation of the terminal spikelet, plant longevity and photosynthetic type were the traits selected for this study. Maximum likelihood and Bayesian Markov chain Monte Carlo methods were used to test different models of evolution and to evaluate the existence of evolutionary correlation among the traits. Both, models and evolutionary correlation were tested and analysed in a phylogenetic context by plotting the characters on a series of trees. For those cases in which the correlation was confirmed, test of contingency and order of trait acquisition were preformed to explore further the patterns of such co-evolution.

Key results: The data reject the independent model of inflorescence trait evolution and confirmed the existence of evolutionary contingency. The results support the general trend of homogenization being a prerequisite for the loss of the terminal spikelet of the main axis. There was no evidence for temporal order in the gain of homogenization and condensation; consequently, the homogenization and condensation could occur simultaneously. The correlation between inflorescence traits with plant longevity and photosynthetic type is not confirmed.

Conclusions: The findings indicate that the lability of the panicoid inflorescence is apparent, not real. The results indicate that the history of the panicoids inflorescence is a combination of inflorescence trait contingency and order of character acquisition. These indicate that developmental and genetic mechanisms may be important constraints that have limited the diversification of the inflorescence form in panicoid grasses.

Keywords: Inflorescence; Panicoideae; Poaceae; evolution; morphology; panicoids.


Figures

Fig. 1.
Fig. 1.
Reconstructed ancestral character states on the Bayesian MCMC majority rule consensus tree. Branch shading indicates maximum parsimony reconstruction (according to Reinheimer et al., 2012). Pie charts indicate Bayesian ancestral characters posterior probabilities at selected nodes. Numbers in parenthesis indicate the state with the highest likelihood based on the Bayes factor (BF) results. Two or more numbers in parenthesis indicates an ambiguous assignation of the ancestral character state. *, BF between 2 and 5 (positive support); **, BF between 5 and 10 (strong support).
Fig. 1.
Fig. 1.
Reconstructed ancestral character states on the Bayesian MCMC majority rule consensus tree. Branch shading indicates maximum parsimony reconstruction (according to Reinheimer et al., 2012). Pie charts indicate Bayesian ancestral characters posterior probabilities at selected nodes. Numbers in parenthesis indicate the state with the highest likelihood based on the Bayes factor (BF) results. Two or more numbers in parenthesis indicates an ambiguous assignation of the ancestral character state. *, BF between 2 and 5 (positive support); **, BF between 5 and 10 (strong support).
Fig. 2.
Fig. 2.
Rates of change between the different states of inflorescence aspect (A), homogenization (B) and truncation (C), obtained using an unordered model of character evolution and MCMC method. (D) Results of the statistical differences among pairs of rates using the non-parametric Mann–Whitney U-test. qi, j indicates the transition from the state i to the state j. An asterisk indicates significant differences under the non-parametric Mann–Whitney U-test.
Fig. 3.
Fig. 3.
Posterior probability distribution of the rate coefficients values of the correlated evolution model using the MCMC method. (A) Inflorescence aspect and homogenization, (B) inflorescence aspect and truncation, and (C) homogenization and truncation. qi, j indicates the transition from the state i to the state j. Z-values represent the proportion of the sampled runs from the Markov chain in which the parameter was assigned a value of zero. Values are the average and the standard deviation of the parameter values from the sampled runs.
Fig. 3.
Fig. 3.
Posterior probability distribution of the rate coefficients values of the correlated evolution model using the MCMC method. (A) Inflorescence aspect and homogenization, (B) inflorescence aspect and truncation, and (C) homogenization and truncation. qi, j indicates the transition from the state i to the state j. Z-values represent the proportion of the sampled runs from the Markov chain in which the parameter was assigned a value of zero. Values are the average and the standard deviation of the parameter values from the sampled runs.
Fig. 4.
Fig. 4.
Flow diagram showing the most probable evolutionary pathway from (A) the ancestral state of lax and homogenized inflorescence to the derived state of condensed and non-homogenized inflorescence, (B) the ancestral state of lax and non-truncated inflorescence to the derived state of condensed and truncated inflorescence, and (C) the ancestral state of homogenized and non-truncated inflorescence to the derived state of non-homogenized and truncated inflorescence. qi, j indicates the transition from the state i to the state j. Thick black arrows highlight transitions that have a low posterior probability of being zero (<5 %), thin arrows denote transitions that have higher probability of being zero (56–64 %) and dotted arrows indicate transitions that have a very high probability of being zero (>80 %). The grey shaded boxes indicate the inferred ancestral state.
Fig. 5.
Fig. 5.
Diagram summarizing our results concerning the macroevolutionary patterns of panicoid inflorescence evolution. The white box represents the ancestral inflorescence type. Grey boxes indicate intermediate inflorescence types. The black box represents the most derived inflorescence type. The dotted arrow indicates an unlikely transition according to MCMC methods. Numbers in the top left corner of the boxes indicate the inflorescence type (see Supplementary Data Fig. S1). Black ovals represent a spikelet. The asterisks represent the missing terminal spikelets of the inflorescence. (A) The evolutionary pathway from the ancestral inflorescence type to the most derived inflorescence type may have occurred via either a five- (–––––6) or three-step (–––6) process. (B) The most likely evolutionary pathway from the most derived inflorescence type to the ancestral inflorescence type.

References

    1. Acosta JM, Perreta M, Amsler A, Vegetti AC. The flowering unit in the synflorescences of Amaranthaceae. Botanical Review. 2009;75:365–376.
    1. Aliscioni SS, Giussani LM, Zuloaga FO, Kellogg EA. A molecular phylogeny of Panicum (Poaceae: Paniceae): test of monophyly and phylogenetic placement within the Panicoideae. American Journal of Botany. 2003;90:796–821. - PubMed
    1. Doust AN, Kellogg EA. Inflorescence diversification in the Panicoid bristle grass clade (Paniceae, Poaceae): evidence from molecular phylogenies and developmental morphology. American Journal of Botany. 2002;89:1203–1222. - PubMed
    1. Doust AN, Devos KM, Gadberry MD, Gale MD, Kellogg EA. The genetic basis for inflorescence variation between foxtail and green millet (Poaceae) Genetics. 2005;169:1659–1672. - PMC - PubMed
    1. Friedman J, Harder LD. Inflorescence architecture and wind pollination in six grass species. Functional Ecology. 2004;18:851–860.

Publication types