

Genomic signatures of pregnancy-associated breast cancer epithelia and stroma and their regulation by estrogens and progesterone
- PMID: 23479404
- PMCID: PMC3810166
- DOI: 10.1007/s12672-013-0136-z
Genomic signatures of pregnancy-associated breast cancer epithelia and stroma and their regulation by estrogens and progesterone
Abstract
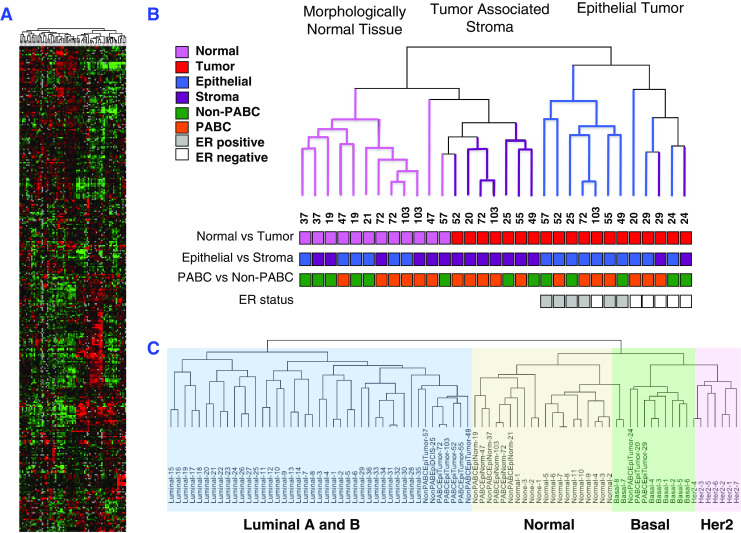
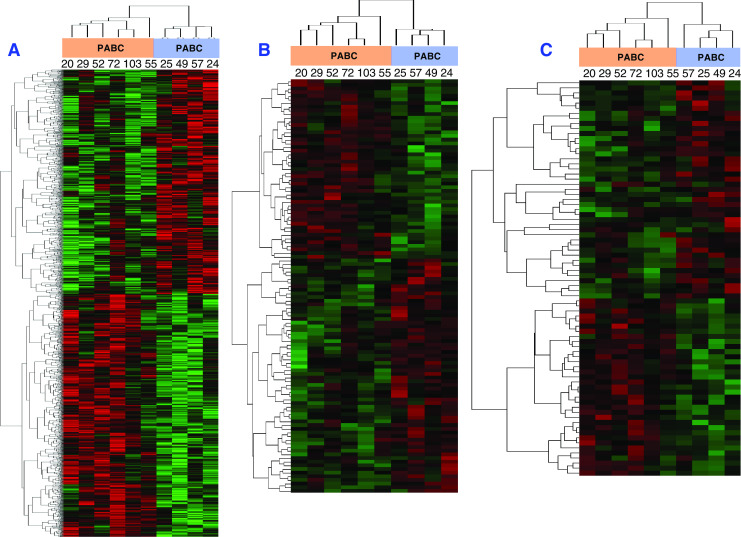
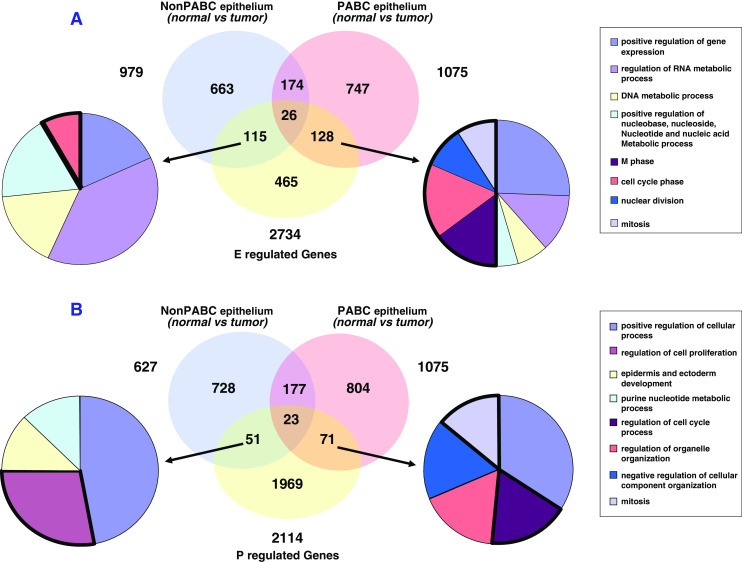
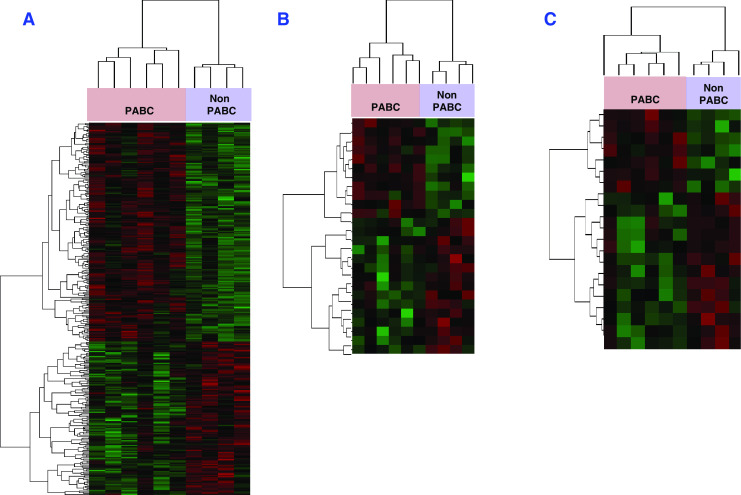
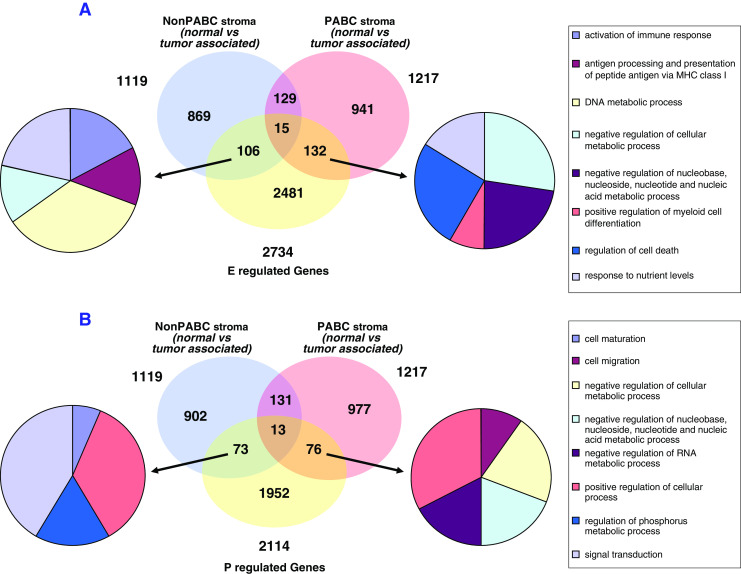
Pregnancy-associated breast cancers (PABC) generally present at advanced stages and have a poor prognosis. The reasons are unclear but we hypothesized that the continuous high levels of estrogens and progesterone were involved. We have now carried out a detailed analysis of PABC compared to tumors of age-matched nonpregnant (non-PABC) women. Malignant epithelia and tumor-associated stroma of PABC and non-PABC were isolated by laser capture microdissection and gene expression profiled. Additionally, normal breast epithelia and stroma adjacent to the two tumor types were analyzed. Lastly, subsets of previously identified E- and P-regulated genes were defined in all tissues. We find that PABC signatures cluster with established breast cancer subtypes. Major hormone-regulated genes whose expression correlated with epithelia of PABC dealt with regulation of cell proliferation, metabolism, and tumor aggressiveness, including genes used to predict tumor recurrence. Compared to normal epithelia, a significant number of genes associated with cell cycle processes were enriched in PABC, many of which are hormone regulated. Thus, compared to normal epithelia, many of the genes that were differentially expressed in epithelia of PABC were distinct from those differentially expressed in non-PABC. With regard to the tumor microenvironment, immune-related genes were enriched in tumor-associated stroma of PABC. Compared to normal stroma, PABC-associated stroma overexpressed immune response genes, while genes involved in angiogenesis and extracellular matrix deposition were more commonly downregulated. This suggests that the heightened aggressiveness of PABC may involve a predisposition to metastasis through extracellular matrix degradation, plus angiogenesis independence. Moreover, genes encoding cell proliferative factors, signaling, immunomodulators and cell death, were hormone regulated in stroma. In sum, these analyses demonstrate complex patterns of enrichment and hormonal regulation of genes in PABC and suggest that it may have a distinct biological nature.
Figures
Similar articles
-
Identification of core genes and clinical roles in pregnancy-associated breast cancer based on integrated analysis of different microarray profile datasets.Biosci Rep. 2019 Jun 25;39(6):BSR20190019. doi: 10.1042/BSR20190019. Print 2019 Jun 28. Biosci Rep. 2019. PMID: 31171715 Free PMC article.
-
Gene expression profiling of the tumor microenvironment during breast cancer progression.Breast Cancer Res. 2009;11(1):R7. doi: 10.1186/bcr2222. Epub 2009 Feb 2. Breast Cancer Res. 2009. PMID: 19187537 Free PMC article.
-
Increased invasiveness and aggressiveness in breast epithelia with cytoplasmic p63 expression.Int J Biol Sci. 2010 Aug 8;6(5):428-42. doi: 10.7150/ijbs.6.428. Int J Biol Sci. 2010. PMID: 20714441 Free PMC article.
-
Updates in the pathology of Pregnancy Associated Breast Cancer (PABC).Pathol Res Pract. 2023 Apr;244:154413. doi: 10.1016/j.prp.2023.154413. Epub 2023 Mar 11. Pathol Res Pract. 2023. PMID: 36921545 Review.
-
Multidisciplinary management of breast cancer concurrent with pregnancy.J Am Coll Surg. 2002 Jan;194(1):54-64. doi: 10.1016/s1072-7515(01)01105-x. J Am Coll Surg. 2002. PMID: 11800340 Review.
Cited by
-
Distinctive gene expression patterns in pregnancy-associated breast cancer.Front Genet. 2022 Aug 10;13:850195. doi: 10.3389/fgene.2022.850195. eCollection 2022. Front Genet. 2022. PMID: 36035177 Free PMC article.
-
Clinical characteristics and pathologic complete response (pCR) rate after neoadjuvant chemotherapy in postpartum women with breast cancer.J Cancer Res Clin Oncol. 2023 Nov;149(15):14185-14204. doi: 10.1007/s00432-023-05194-z. Epub 2023 Aug 9. J Cancer Res Clin Oncol. 2023. PMID: 37555951 Free PMC article.
-
Breast Carcinogenesis during Pregnancy: Molecular Mechanisms, Maternal and Fetal Adverse Outcomes.Biology (Basel). 2023 Mar 6;12(3):408. doi: 10.3390/biology12030408. Biology (Basel). 2023. PMID: 36979100 Free PMC article. Review.
-
Multidisciplinary management of pregnancy-associated and early post-partum head and neck cancer patients.Front Oncol. 2023 Nov 22;13:1298439. doi: 10.3389/fonc.2023.1298439. eCollection 2023. Front Oncol. 2023. PMID: 38074678 Free PMC article.
-
Combination of furosemide, gold, and dopamine as a potential therapy for breast cancer.Funct Integr Genomics. 2023 Mar 21;23(2):94. doi: 10.1007/s10142-023-01007-1. Funct Integr Genomics. 2023. PMID: 36943579
References
-
- Vinatier E, Merlot B, Poncelet E, Collinet P, Vinatier D. Breast cancer during pregnancy. Eur J Obstet Gynecol Reprod Biol. 2009;147:9–14. - PubMed
-
- Petrek JA. Pregnancy safety after breast cancer. Cancer. 1994;74:528–531. - PubMed
-
- Nixon AJ, Neuberg D, Hayes DF, Gelman R, Connolly JL, Schnitt S, Abner A, Recht A, Vicini F, Harris JR. Relationship of patient age to pathologic features of the tumor and prognosis for patients with stage I or II breast cancer. J Clin Oncol. 1994;12:888–894. - PubMed
-
- Horwitz KB, McGuire WL. Nuclear mechanisms of estrogen action. Effects of estradiol and anti-estrogens on estrogen receptors and nuclear receptor processing. J Biol Chem. 1978;253:8185–8191. - PubMed
Publication types
MeSH terms
Substances
Grants and funding
LinkOut - more resources
Full Text Sources
Other Literature Sources
Medical
Molecular Biology Databases
