. 2013 Mar 26;110(13):4968-73.
doi: 10.1073/pnas.1302825110. Epub 2013 Mar 11.

Differential expression profiles of glycosphingolipids in human breast cancer stem cells vs. cancer non-stem cells

Affiliations

Differential expression profiles of glycosphingolipids in human breast cancer stem cells vs. cancer non-stem cells

Yuh-Jin Liang et al. Proc Natl Acad Sci U S A. .

Abstract

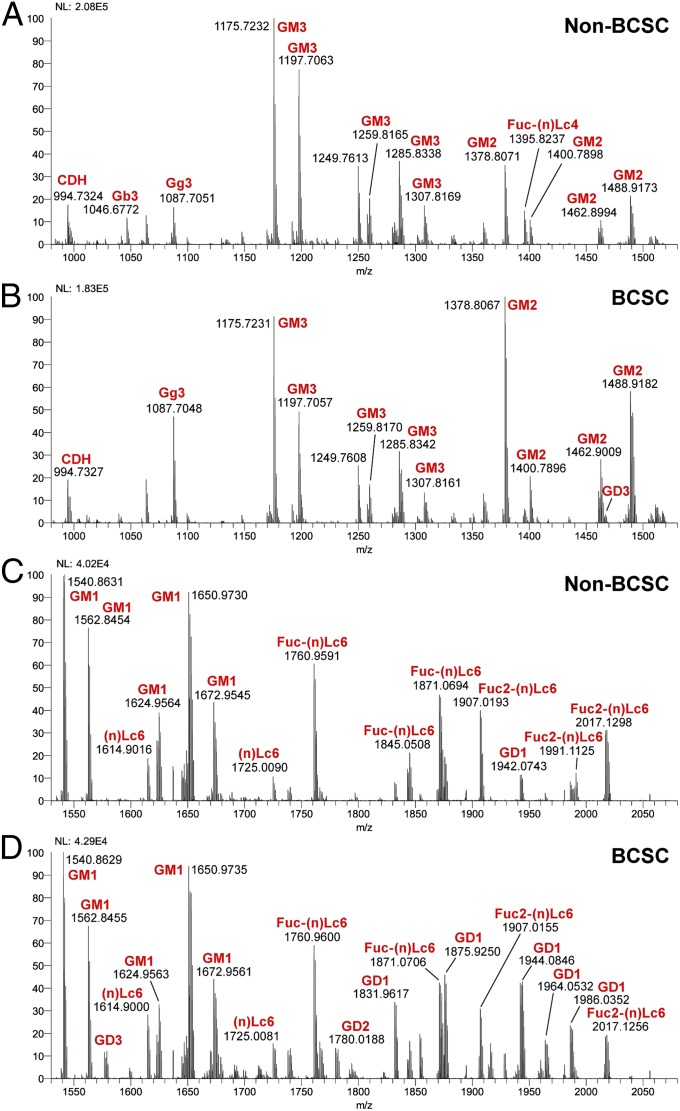
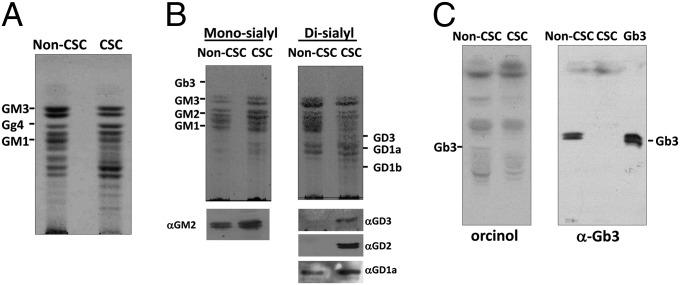
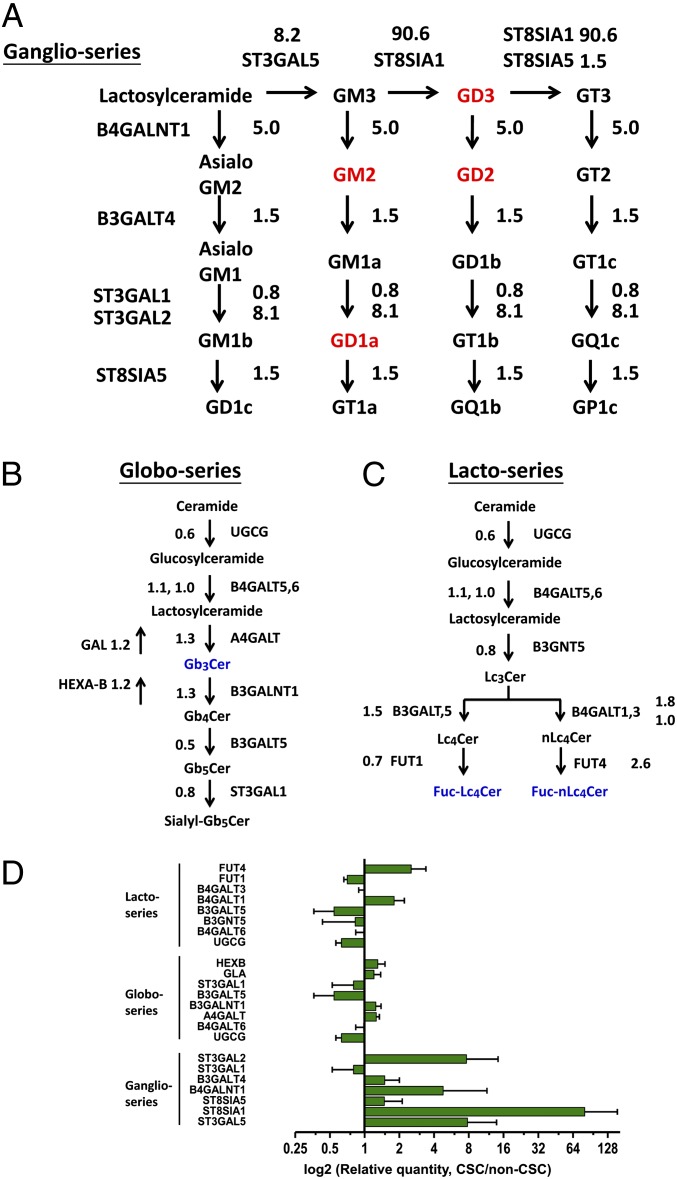
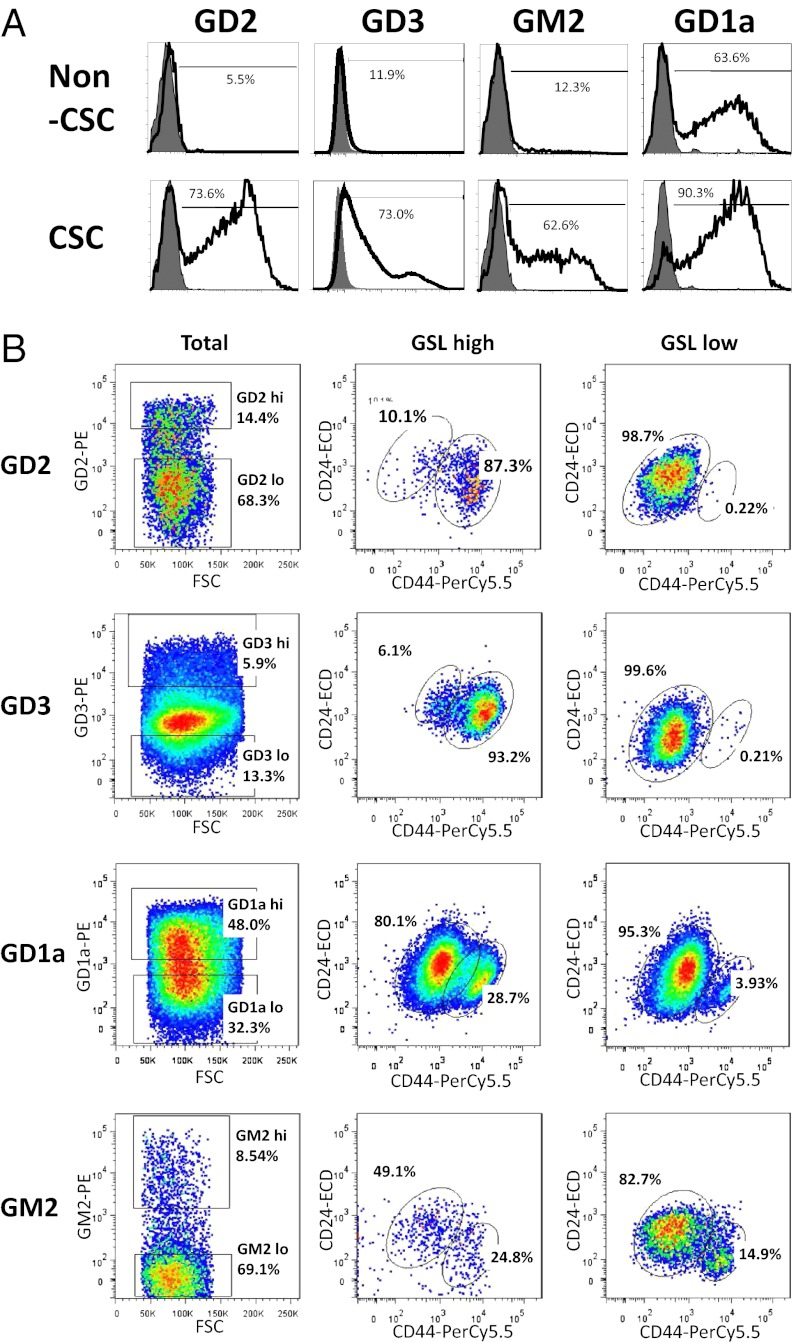
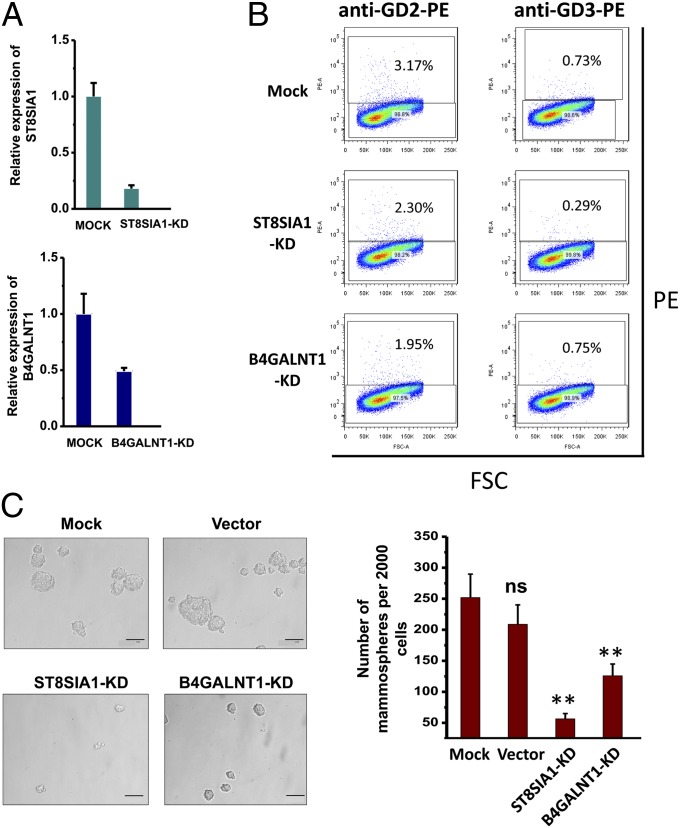
Previous studies demonstrated that certain glycosphingolipids (GSLs) are involved in various cell functions, such as cell growth and motility. Recent studies showed changes in GSL expression during differentiation of human embryonic stem cells; however, little is known about expression profiles of GSLs in cancer stem cells (CSCs). CSCs are a small subpopulation in cancer and are proposed as cancer-initiating cells, have been shown to be resistant to numerous chemotherapies, and may cause cancer recurrence. Here, we analyzed GSLs expressed in human breast CSCs by applying a CSC model induced through epithelial-mesenchymal transition, using mass spectrometry, TLC immunostaining, and cell staining. We found that (i) Fuc-(n)Lc4Cer and Gb3Cer were drastically reduced in CSCs, whereas GD2, GD3, GM2, and GD1a were greatly increased in CSCs; (ii) among various glycosyltransferases tested, mRNA levels for ST3GAL5, B4GALNT1, ST8SIA1, and ST3GAL2 were increased in CSCs, which could explain the increased expression of GD3, GD2, GM2, and GD1a in CSCs; (iii) the majority of GD2+ cells and GD3+ cells were detected in the CD44(hi)/CD24(lo) cell population; and (iv) knockdown of ST8SIA1 and B4GALNT1 significantly reduced the expression of GD2 and GD3 and caused a phenotype change from CSC to a non-CSC, which was detected by reduced mammosphere formation and cell motility. Our results provide insight into GSL profiles in human breast CSCs, indicate a functional role of GD2 and GD3 in CSCs, and suggest a possible novel approach in targeting human breast CSCs to interfere with cancer recurrence.


Conflict of interest statement

The authors declare no conflict of interest.

Figures

Fig. 1.
Fig. 1.
ESI-MS molecular ion profiles of GSLs from non-CSCs and CSCs. Full spectrums for non-CSCs and CSCs were separated into two groups, m/z 980–1,530 and m/z 1,530–2,080 as indicated. (A–D) Annotations of GSLs on the spectrum were assigned based on m/z values typical for ceramide moiety-associated fatty acyl heterogeneity. We deduced that GSLs with the same glycan moiety but different fatty acyl components are the same GSL. NL represents a measure of absolute spectral counts for the most abundant peak (100% on the y-axis) in respective segments.
Fig. 2.
Fig. 2.
HPTLC profiles of GSLs extracted from non-CSCs and CSCs. (A) Upper-phase GSLs from 5 × 10⁶ non-CSCs and CSCs were separated on an HPTLC plate and visualized by orcinol spraying. (B) Monosialoganglioside (Mono-sialyl) GSL or disialoganglioside (Di-sialyl) GSL fractions were separated from total polar upper-phase GSLs with DEAE-Sephadex columns. GSLs were visualized by orcinol spraying and characterized by immunostaining with mAbs specific to GM2, GD3, GD2, or GD1a. (C) Lower-phase GSLs from 5 × 10⁶ non-CSCs and CSCs were processed for the detection by orcinol spraying or immunostaining with anti-Gb3Cer mAb.
Fig. 3.
Fig. 3.
Changes in mRNA levels of GTs between non-CSCs and CSCs. GTs involved in the synthesis of (A) ganglio-series GSLs, (B) globo-series GSLs, and (C) lacto- or neolacto-series GSLs are shown. The expression levels of GT genes were analyzed and quantified by real-time RT-PCR. GSLs up-regulated in CSCs are distinguished in red. GSLs down-regulated in CSCs are distinguished in blue. Diagram quantities represent the ratio of expression of CSCs to non-CSCs. (D) Fold changes of GT gene expression between non-CSCs and CSCs were summarized. Values on the y-axis represent log2 relative quantities. Data represent the mean of three independent experiments. Error bars represent 1 SD from the mean of relative quantities.
Fig. 4.
Fig. 4.
Correlation of the expression levels of the GSLs with the CD44hi/CD24lo phenotype. (A) The expressions of GSLs in CSCs and non-CSCs were analyzed by flow cytometry. Up-regulation of GD2, GD3, GM2, and GD1a in CSCs were detected with flow cytometry. Cells were stained with antibodies against indicated GSLs and are shown with solid line. Stained isotype controls are shown in gray. Values presented the mean of three experiments. (B) HMLE-Twist-ER cells were triple-stained with anti–CD44-PC5, anti–CD24-ECD, and GSL-specific antibodies conjugated with phycoerythrin then analyzed by flow cytometry. Plots are gated for GSL-high or GSL-low populations in plots labeled “Total.” Plots are gated for CD44hi and CD24lo in plots labeled “GSL high” and “GSL low.”
Fig. 5.
Fig. 5.
Knockdown of ST8SIA1, B4GALNT1, or ST3GAL5 reduces mammosphere formation in MCF-7 cells. (A) Real-time RT-PCR illustrates a reduction in mRNA levels after transfection of shRNA against ST8SIA1 or B4GALNT1. Relative expressions for target genes are shown on the y-axis. (B) Expression of GD2 or GD3 decreased after knockdown of ST8SIA1 and B4GALNT1. GD2 or GD3 expression (y-axis) and forward scatter (FSC) (x-axis) are shown. Percentages represent GSL-positive cells plots. (C) Mammosphere formation of mock control, vector control, ST8SIA1-KD, or B4GALNT1-KD cells. Microscope magnification was ×200. Data represent the mean of three independent experiments. ns, not significant; **P ≤ 0.005. (Scale bar, 0.1 mm.)

References

    1. Handa K, Hakomori SI. Carbohydrate to carbohydrate interaction in development process and cancer progression. Glycoconj J. 2012;29(8-9):627–637. - PubMed
    1. Hakomori SI. Glycosynaptic microdomains controlling tumor cell phenotype through alteration of cell growth, adhesion, and motility. FEBS Lett. 2010;584(9):1901–1906. - PMC - PubMed
    1. International Union of Pure and Applied Chemistry and International Union of Biochemistry Commission on Biochemical Nomenclature The nomenclature of lipids. Recommendations 1976. Lipids. 1977;12(6):455–468. - PubMed
    1. Svennerholm L. The Gangliosides. J Lipid Res. 1964;5:145–155. - PubMed
    1. Hakomori SI, Murakami WT. Glycolipids of hamster fibroblasts and derived malignant-transformed cell lines. Proc Natl Acad Sci USA. 1968;59(1):254–261. - PMC - PubMed

Publication types

MeSH terms