. 2013 Mar 26;110(13):5175-80.
doi: 10.1073/pnas.1210735110. Epub 2013 Mar 11.

Synaptic plasticity by antidromic firing during hippocampal network oscillations

Affiliations

Synaptic plasticity by antidromic firing during hippocampal network oscillations

Olena Bukalo et al. Proc Natl Acad Sci U S A. .

Abstract

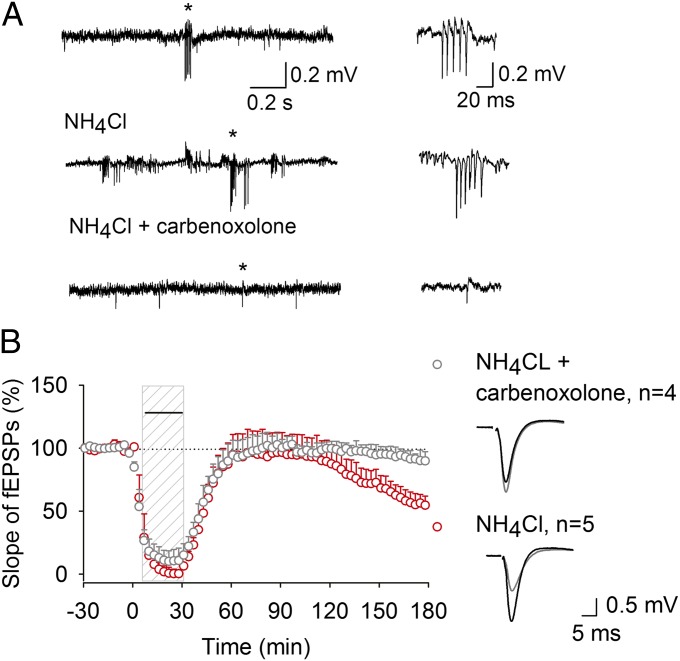
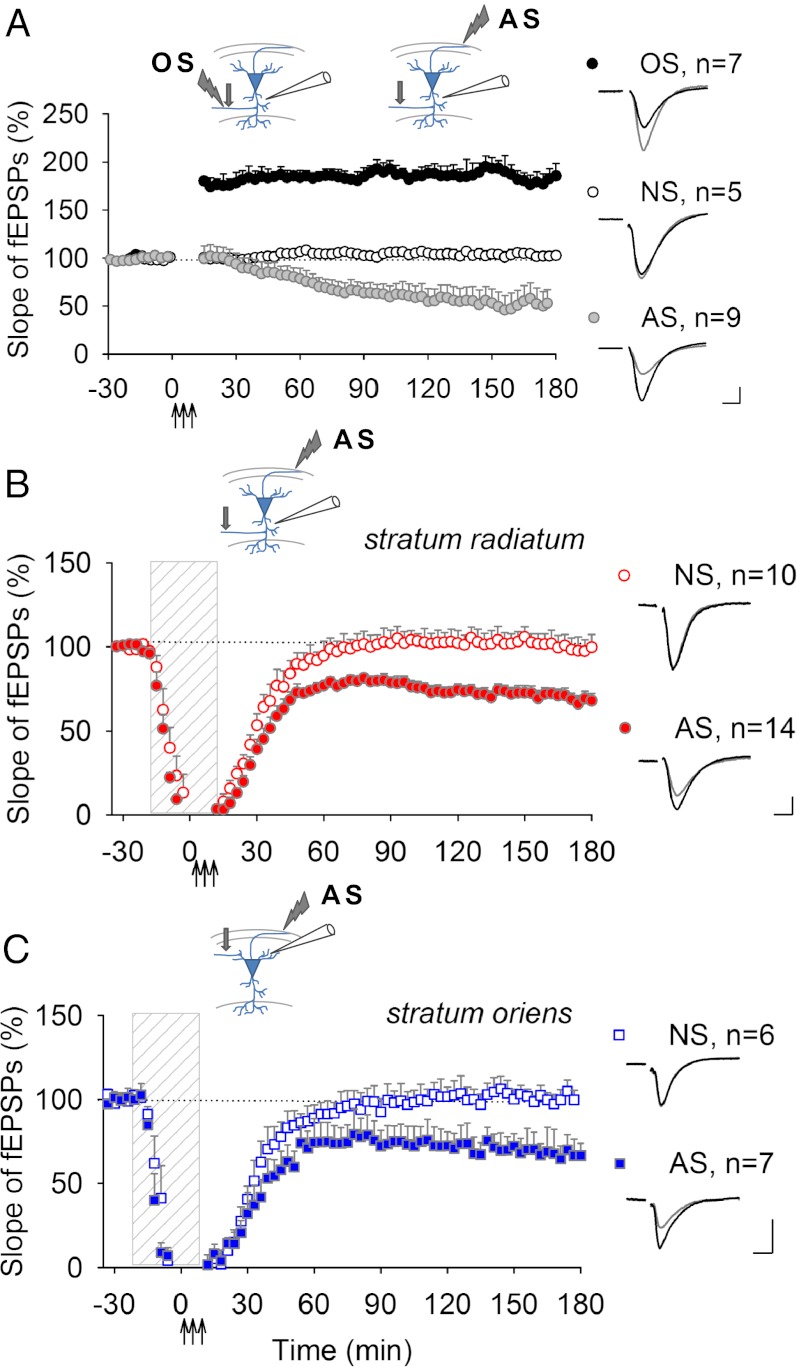
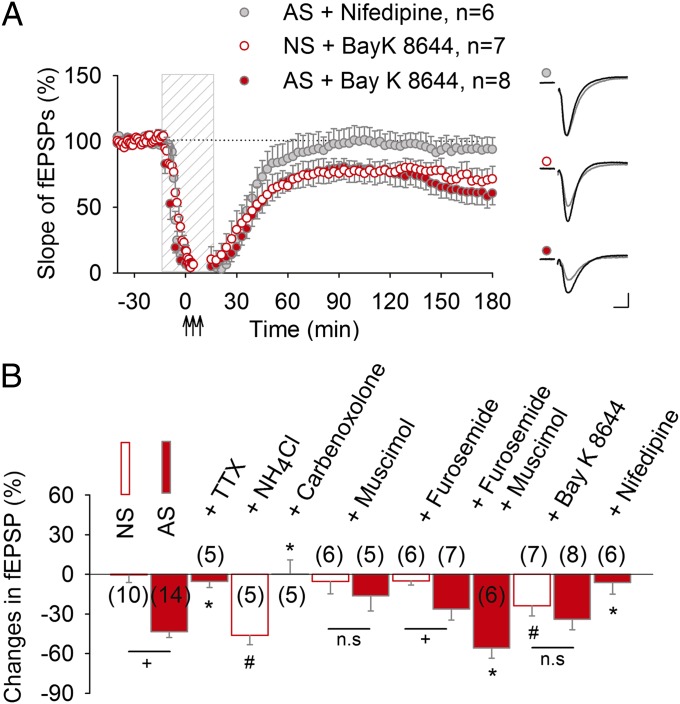
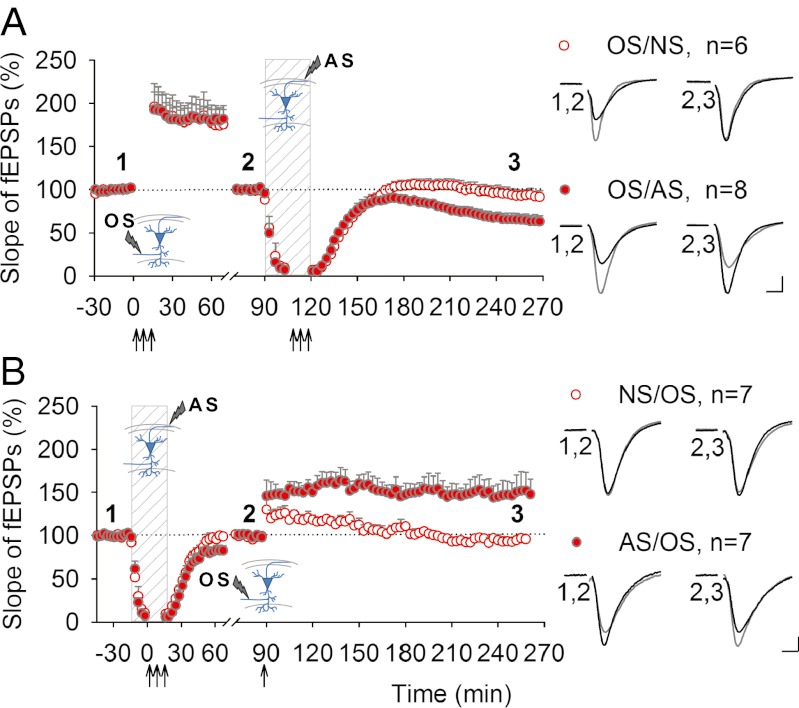
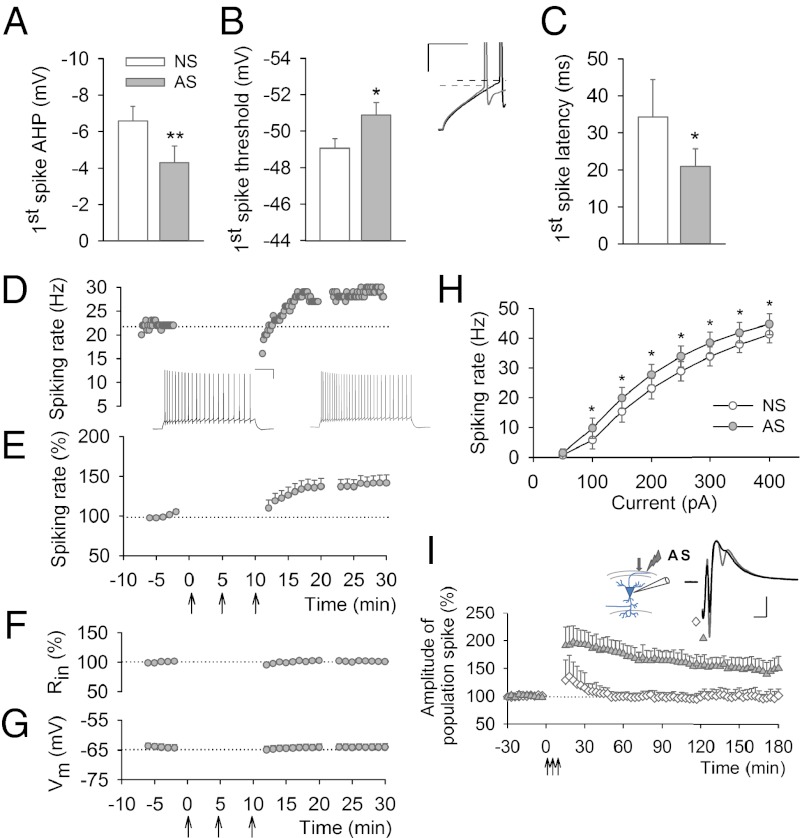
Learning and other cognitive tasks require integrating new experiences into context. In contrast to sensory-evoked synaptic plasticity, comparatively little is known of how synaptic plasticity may be regulated by intrinsic activity in the brain, much of which can involve nonclassical modes of neuronal firing and integration. Coherent high-frequency oscillations of electrical activity in CA1 hippocampal neurons [sharp-wave ripple complexes (SPW-Rs)] functionally couple neurons into transient ensembles. These oscillations occur during slow-wave sleep or at rest. Neurons that participate in SPW-Rs are distinguished from adjacent nonparticipating neurons by firing action potentials that are initiated ectopically in the distal region of axons and propagate antidromically to the cell body. This activity is facilitated by GABA(A)-mediated depolarization of axons and electrotonic coupling. The possible effects of antidromic firing on synaptic strength are unknown. We find that facilitation of spontaneous SPW-Rs in hippocampal slices by increasing gap-junction coupling or by GABA(A)-mediated axon depolarization resulted in a reduction of synaptic strength, and electrical stimulation of axons evoked a widespread, long-lasting synaptic depression. Unlike other forms of synaptic plasticity, this synaptic depression is not dependent upon synaptic input or glutamate receptor activation, but rather requires L-type calcium channel activation and functional gap junctions. Synaptic stimulation delivered after antidromic firing, which was otherwise too weak to induce synaptic potentiation, triggered a long-lasting increase in synaptic strength. Rescaling synaptic weights in subsets of neurons firing antidromically during SPW-Rs might contribute to memory consolidation by sharpening specificity of subsequent synaptic input and promoting incorporation of novel information.


Conflict of interest statement

The authors declare no conflict of interest.

Figures

Fig. 1.
Fig. 1.
Facilitation of spontaneous SPW-Rs leads to reduction in synaptic strength. (A) Representative field potential recording of spontaneous SPW-Rs recorded in stratum pyramidale of area CA1 (Top). Opening gap junctions with NH4Cl (10 mM) added to perfusate in the presence of glutamatergic antagonists kynurenic acid (3 mM), DL-2-Amino-5-phosphonopentanoic acid (APV) (50 μM), and (RS)-α-Methyl-4-carboxyphenylglycine (MCPG) (250 μM) increased the number and duration of spontaneous SPW-Rs in CA1 (Middle), which is prevented by gap-junction blocker carbenoxolone (100 μM) (Bottom). Corresponding expanded events are shown on the right. (B) LTD can be induced by NH4Cl in the presence of glutamatergic antagonists (dashed vertical bar) (53.8 ± 7.2%, P < 0.05) and is blocked by addition of carbenoxolone (92.5 ± 9.1%, P < 0.01). Carbenoxolone and NH4Cl application is indicated by horizontal bar. Representative synaptic responses evoked and recorded in the stratum radiatum before (black) and after (gray) treatment are shown on the right.
Fig. 2.
Fig. 2.
Widespread depression is induced by antidromic stimulation (AS). (A) Recordings in the stratum radiatum demonstrating L-LTP in response to orthodromic stimulation (OS) (182.5 ± 11.0%, P < 0.001), but LTD was induced by AS of axons in the alveus (AS, 53.6 ± 15.3%, P < 0.05). There were no changes in nonstimulated (NS) slices (103.5 ± 5.0%, P = 0.42). (B and C) Antidromic stimulation delivered to the alveus during application of glutamatergic antagonists (dashed vertical bar) induced AP-LTD in stratum radiatum (B, 67.3 ± 3.6%, P < 0.001) and in stratum oriens (C, 64.1 ± 9.2%, P < 0.05). Transient blockade of synaptic transmission had no long-lasting effect on synaptic responses in either stratum radiatum or stratum oriens (99.7 ± 5.9%, P = 0.15 and 96.3 ± 2.3%, P = 0.77, correspondingly). The insets show electrode placement (arrow indicates position of the test stimulation electrode) and representative synaptic responses before (black) and after (gray) repetitive stimulation. (Calibration, 0.5 mV, 5 ms.)
Fig. 3.
Fig. 3.
Mechanism of AP-LTD induction. (A) Either 10 μM nifedipine or 10 μM Bay K 8644 were added to block or activate L-VDCCs. Application of nifedipine abolished AP-LTD (92.2 ± 19.7%, P < 0.01). In contrast, Bay K 8644 did not affect the magnitude of AP-LTD (65.9 ± 8.0%, P = 0.89) but was sufficient to induce long-lasting fEPSPs depression (76.1 ± 7.7%, P < 0.05, comparing to NS slices). Indicated drugs were applied to NS or antidromically stimulated slices (AS) during perfusion with glutamatergic antagonists (dashed vertical bar). Representative synaptic responses evoked and recorded in the stratum radiatum before (black) and after (gray) repetitive stimulation are shown on the right. (Calibration, 0.5 mV, 5 ms.) (B) Summary data of changes in synaptic strength 160–180 min after LTD induction in the presence of indicated drugs (*P < 0.05, comparing to AS slices; # P < 0.05, comparing to NS slices; + P < 0.05 and n.s. P > 0.05, comparing NS and AS slices treated similarly; Student t test).
Fig. 4.
Fig. 4.
AP-LTD interaction with synaptically induced L-LTP. (A) L-LTP expression was not affected by transient blockade of glutamatergic transmission (OS/NS, 92.2 ± 6.5%), but was depotentiated by AS (OS/AS, 62.8 ± 7.4%; P < 0.05). (B) Weak TBS delivered to NS slices after washout of glutamatergic antagonists induced an early form of LTP, which decayed within 3 h to prestimulated level (NS/OS, 95.1 ± 3.8%). In contrast, if the same stimulation was delivered to antidromically stimulated slices, robust LTP developed in the stratum radiatum (AS/OS, 148.7 ± 19.0%; P < 0.05). OS, orthodromic stimulation of Schaffer collaterals; AS, antidromic stimulation of axons in the alveus; NS, no stimulation was delivered. The mean slopes of fEPSPs were normalized to pre-TBS level and renormalized to 100% before the second stimulus. The insets show stimulation electrode placement. Representative synaptic responses evoked and recorded in the stratum radiatum before (black) and after (gray) stimulation are shown at the indicated time points. (Calibration, 0.5 mV, 5 ms.) Perfusion with glutamatergic antagonists marked with dashed vertical bar.
Fig. 5.
Fig. 5.
Antidromically induced increase in excitability. (A–C) Whole-cell recording revealed an increase in excitability associated with decreased first spike after hyperpolarization (AHP) [A; 6.6±0.8 mV before (NS) and 4.3±0.9 mV after (AS) stimulation], first spike threshold (B; NS, –49.1 ± 0.5 mV; AS, –50.9 ± 0.7 mV) and first spike latency (C; NS, 34.2 ± 10.2 ms; AS, 21.0 ± 4.7 mV), after AS (*P < 0.05, **P < 0.01, paired t test). (D and E) Antidromically induced increase in the spiking rate of pyramidal CA1 neurons (141.1 ± 9.5%; P < 0.01, n = 7): time course of spiking rate in a representative example (D) and pooled data (E). Note that normalized input resistance (F), and resting membrane potential (G), remained stable, indicating that the passive membrane properties did not change after AS. (H) A leftward shift in the average input/output curve in response to AS (*P < 0.05, paired t test). (I) Extracellular recordings of population spikes of antidromic origin demonstrated that AS results in a long-lasting increase in amplitude of the somato-dendritic component (filled triangle) of the population spikes (164.9 ± 16.5%, P < 0.01, n = 6), while the axonal component (diamond) remained unaltered throughout the recording duration (97.2 ± 11.3%, P = 0.77, n = 5). The insets show electrode placement (arrow indicates position of the test stimulation electrode) (I) and representative traces illustrating the decrease in the first spike threshold (dashed line), first spike AHP and first spike latency (B), increase in the spiking rate (D), and antidromic population spike (I) before (black) and after (gray) AS. [Calibrations, 20 ms, 10 mV (B); 200 ms, 20 mV (D); 0.5 mV, 5 ms (I).]

References

    1. Buzsáki G. Two-stage model of memory trace formation: A role for “noisy” brain states. Neuroscience. 1989;31(3):551–570. - PubMed
    1. Wilson MA, McNaughton BL. Reactivation of hippocampal ensemble memories during sleep. Science. 1994;265(5172):676–679. - PubMed
    1. Lewis PA, Durrant SJ. Overlapping memory replay during sleep builds cognitive schemata. Trends Cogn Sci. 2011;15(8):343–351. - PubMed
    1. Nader K, Schafe GE, LeDoux JE. The labile nature of consolidation theory. Nat Rev Neurosci. 2000;1(3):216–219. - PubMed
    1. Chrobak JJ, Buzsáki G. High-frequency oscillations in the output networks of the hippocampal-entorhinal axis of the freely behaving rat. J Neurosci. 1996;16(9):3056–3066. - PMC - PubMed

Publication types

Substances

LinkOut - more resources