. 2013 Apr;172(1):129-37.
doi: 10.1111/cei.12045.

Ex-vivo analysis of human natural killer T cells demonstrates heterogeneity between tissues and within established CD4(+) and CD4(-) subsets

Affiliations

Ex-vivo analysis of human natural killer T cells demonstrates heterogeneity between tissues and within established CD4(+) and CD4(-) subsets

A C Chan et al. Clin Exp Immunol. 2013 Apr.

Abstract

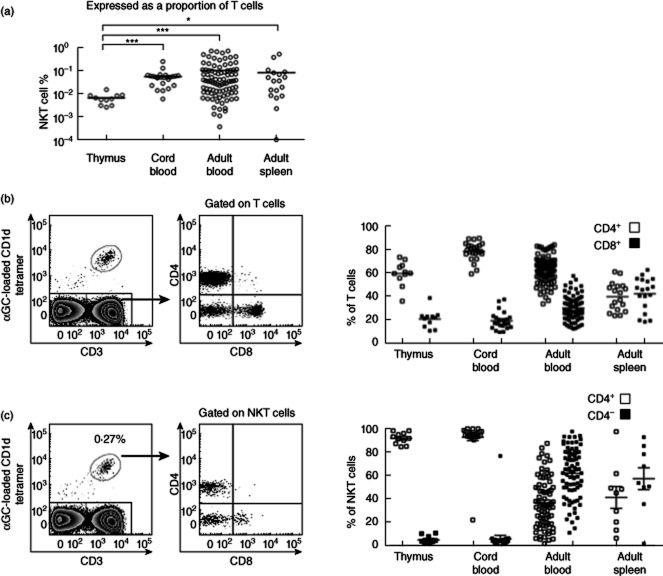
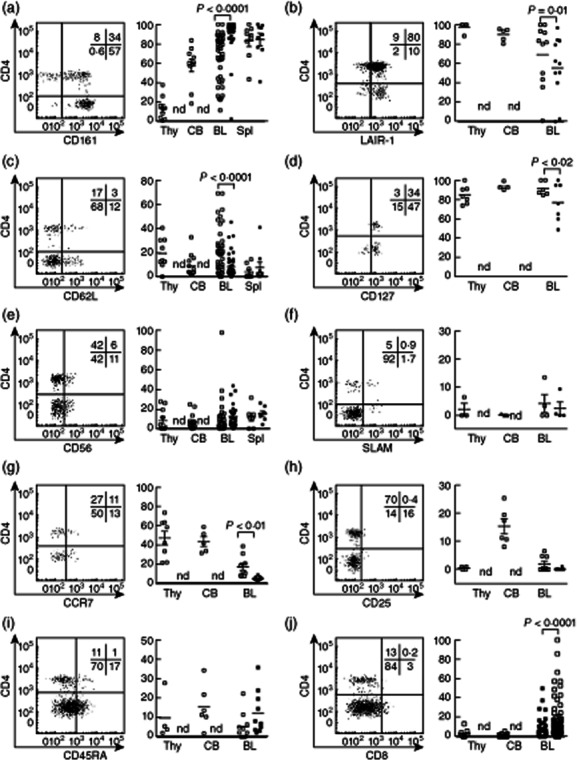
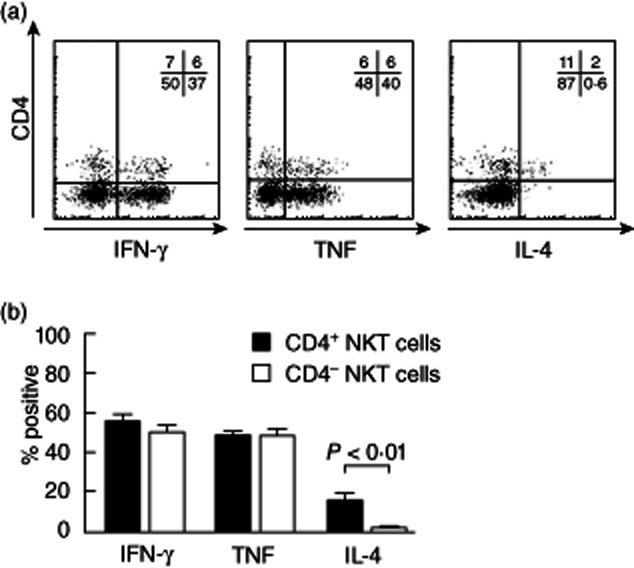
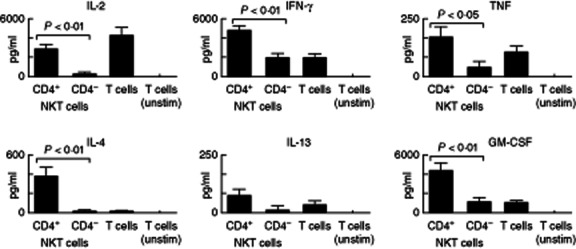
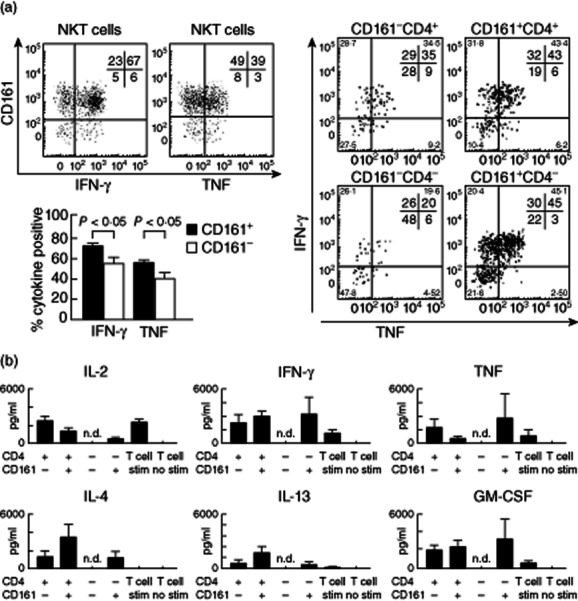
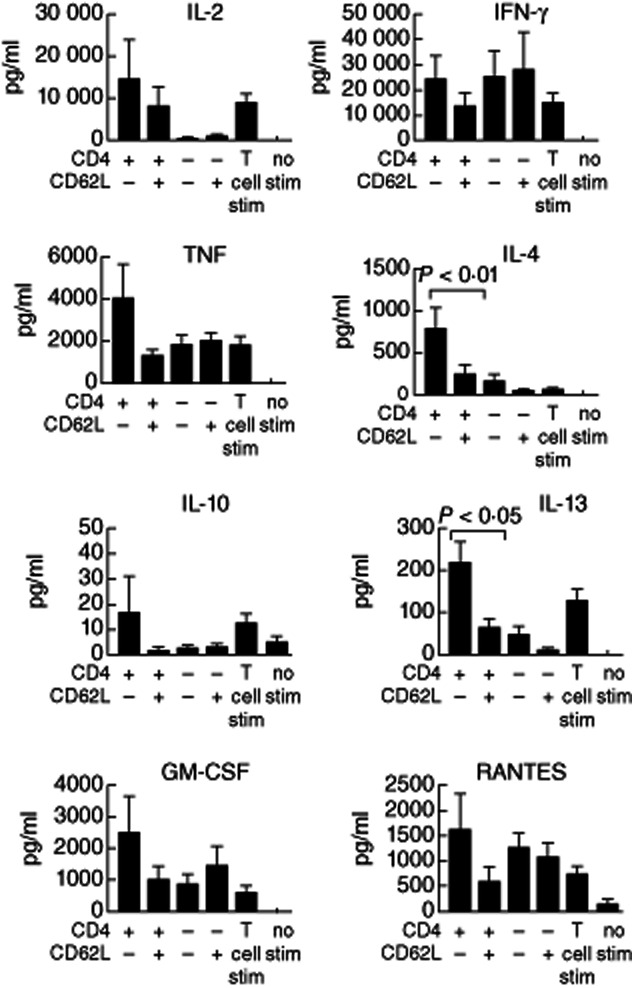
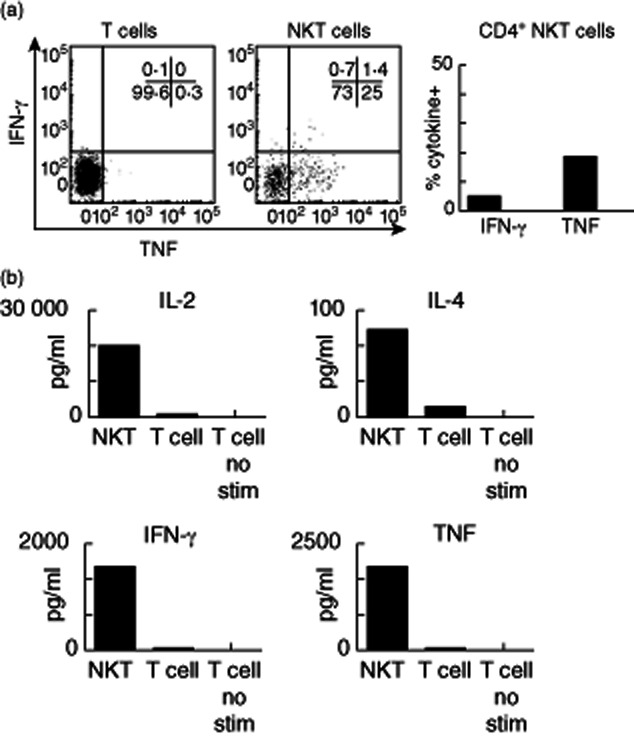
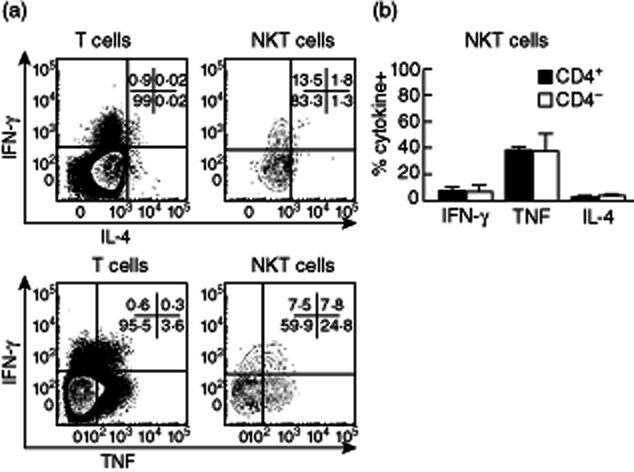
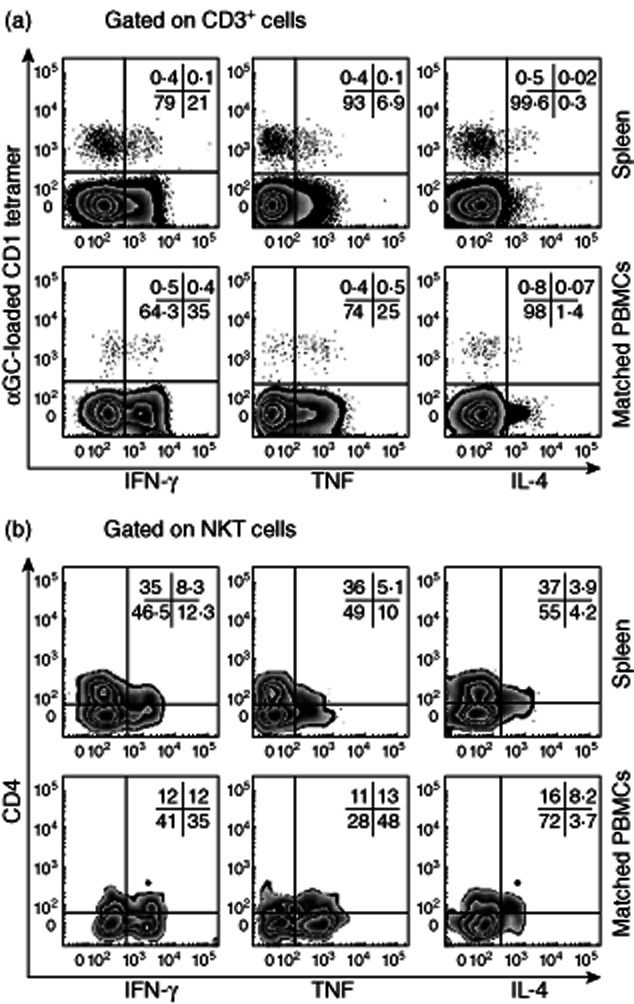
Our understanding of human type 1 natural killer T (NKT) cells has been heavily dependent on studies of cells from peripheral blood. These have identified two functionally distinct subsets defined by expression of CD4, although it is widely believed that this underestimates the true number of subsets. Two recent studies supporting this view have provided more detail about diversity of the human NKT cells, but relied on analysis of NKT cells from human blood that had been expanded in vitro prior to analysis. In this study we extend those findings by assessing the heterogeneity of CD4(+) and CD4(-) human NKT cell subsets from peripheral blood, cord blood, thymus and spleen without prior expansion ex vivo, and identifying for the first time cytokines expressed by human NKT cells from spleen and thymus. Our comparative analysis reveals highly heterogeneous expression of surface antigens by CD4(+) and CD4(-) NKT cell subsets and identifies several antigens whose differential expression correlates with the cytokine response. Collectively, our findings reveal that the common classification of NKT cells into CD4(+) and CD4(-) subsets fails to reflect the diversity of this lineage, and that more studies are needed to establish the functional significance of the antigen expression patterns and tissue residency of human NKT cells.


Figures

Figure 1
Figure 1
Human natural killer T (NKT) cell frequency and CD4+ and CD4 subset distribution. (a) Frequency of total NKT cells expressed as a percentage of CD3+ cells in thymus (n = 11), spleen (n = 18), cord blood (n = 25) and peripheral blood (n = 89) from adults. Representative distribution of T cells (b) and NKT cell subsets (c) defined by expression of CD4 and CD8. Right-hand graphs show collective results. Statistical analysis using Kruskal–Wallis with Dunn's multiple comparisons post-test (b,c).
Figure 2
Figure 2
Heterogeneous cell surface antigen expression within CD4+ (white squares) and CD4 (black squares) natural killer T (NKT) cell compartments. (a) CD161 (thymus: n = 10; cord blood: n = 10; adult blood: n = 50); (b) leucocyte-associated immunoglobulin-like receptor 1 (LAIR-1) (thymus: n = 5; cord blood: n = 5; adult blood: n = 11); (c) CD62L (thymus: n = 9; cord blood: n = 11; adult blood: n = 43); (d) CD127 (thymus: n = 7; cord blood: n = 3; adult blood: n = 5); (e) CD56 (thymus: n = 12; cord blood: n = 14; adult blood: n = 28); (f) signalling lymphocyte activation molecule (SLAM) (thymus; n = 3, cord blood; n = 3, adult blood; n = 4) (g) CCR7, (h) CD25, (i) CD45RA and (j) CD8; n.d. denotes that CD4 NKT cells from thymus and cord blood were not detected or were at frequencies too low for meaningful comparisons with CD4+ NKT cells. Representative plots are lymphocytes from adult blood. Histograms show means ± standard error of the mean in CD4+ (white squares) and CD4 (black squares). n-values are thymus: n = 3–10; cord blood: n = 3–10; adult blood: n = 4–50. Statistical analysis using Wilcoxon test.
Figure 3
Figure 3
Differential cytokine production by human CD4+ and CD4 natural killer T (NKT) cell subsets derived from peripheral blood. (a) Representative fluorescence activated cell sorter (FACS) plots show interferon (IFN)-γ, tumour necrosis factor (TNF) and interleukin (IL)-4 production by CD4+ and CD4 NKT cells after 4 h phorbol myristate acetate (PMA)/ionomycin stimulation. (b) Histograms show the proportion of NKT cells that secrete IFN-γ (n = 27), TNF (n = 27) and IL-4 (n = 9) after 4 h PMA/ionomycin stimulation. Error bars show standard error of the mean.
Figure 4
Figure 4
Cytokine yields in CD4+ and CD4 natural killer T (NKT) cell culture supernatants. CD4+ and CD4 (n = 9) subsets were sorted and cultured overnight with phorbol myristate acetate (PMA)/ionomycin. Cytometric bead array (CBA) was used to quantify cytokines in culture supernatants. Data are normalized to reflect cultures of 10 000 cells equivalent. Statistical analysis using Wilcoxon test.
Figure 5
Figure 5
CD161 expression identifies functionally distinct natural killer T (NKT) cells within established subsets. Representative fluorescence activated cell sorter (FACS) plots show interferon (IFN)-γ and tumour necrosis factor (TNF) production by CD4+ and CD4 NKT cells from adult human blood after 4 h PMA/ionomycin stimulation. Graphs show the proportion of NKT cells that secrete IFN-γ and/or TNF after 4 h PMA/ionomycin stimulation (n = 18). Cytokine expression by sorted populations of CD4+CD161, CD4+CD161+, CD4CD161 and CD4CD161+ (n = 4) NKT cell subsets are shown in right-hand representative plots. (b) Cytometric bead array (CBA) was used to quantify concentrations of six different cytokines in culture supernatants; n.d. indicates that insufficient numbers of CD4CD161 cells were sorted to generate meaningful CBA data. Data are normalized to reflect cultures of 10 000 cells equivalent. Statistical analysis using Wilcoxon test.
Figure 6
Figure 6
CD62L expression identifies functionally distinct blood natural killer T (NKT) cells within established subsets. CD4+CD62L, CD4+CD62L+, CD4CD62L and CD4CD62L+ (n = 6) NKT cell subsets from adult human blood were sorted and cultured overnight with phorbol myristate acetate (PMA)/ionomycin. Cytometric bead array (CBA) was used to quantify cytokines in culture supernatants. Data are normalized to 10 000 cells equivalent.
Figure 7
Figure 7
Cytokine expression by thymic natural killer T (NKT) cells. (a) NKT cells from adult thymus were sorted and stimulated overnight with phorbol myristate acetate (PMA)/ionomycin. Representative fluorescence activated cell sorter (FACS) profiles (left and middle) and the proportion of cytokine-positive NKT cells are shown (upper right) (n = 2). (b) Cytometric bead array (CBA) was used to quantify cytokines from sorted thymic NKT cells and T cells in culture supernatants. Data are from two experiments normalized to 10 000 cells equivalent.
Figure 8
Figure 8
Cord blood natural killer T (NKT) cells produce cytokines when stimulated. Peripheral blood mononuclear cells (PBMCs) from cord blood were stimulated for 4 h with phorbol myristate acetate (PMA)/ionomycin. (a) Fluorescence activated cell sorter (FACS) plots show the percentage of T cells and NKT cells that produced interferon (IFN)-γ, tumour necrosis factor (TNF) and interleukin (IL)-4. (b) Histograms represent mean percentages of CD4+ and CD4 cord blood NKT cell subsets that make IFN-γ, TNF and IL-4 (n = 6).
Figure 9
Figure 9
Cytokine production by natural killer T (NKT) cells from spleen. (a) Cytokine expression by donor-matched T and NKT cells from spleen and blood. (b) Cytokine expression by donor-matched CD4+ and CD4 NKT cells from spleen and blood (representative of four spleen samples; one with matched blood sample shown).

References

    1. Godfrey DI, MacDonald HR, Kronenberg M, Smyth MJ, Van Kaer L. NKT cells: what's in a name? Nat Rev Immunol. 2004;4:231–237. - PubMed
    1. Terabe M, Berzofsky JA. The role of NKT cells in tumor immunity. Adv Cancer Res. 2008;101:277–348. - PMC - PubMed
    1. Balato A, Unutmaz D, Gaspari AA. Natural killer T cells: an unconventional T-cell subset with diverse effector and regulatory functions. J Invest Dermatol. 2009;129:1628–1642. - PubMed
    1. Wu L, Van Kaer L. Natural killer T cells and autoimmune disease. Curr Mol Med. 2009;9:4–14. - PubMed
    1. Godfrey DI, Kronenberg M. Going both ways: immune regulation via CD1d-dependent NKT cells. J Clin Invest. 2004;114:1379–1388. - PMC - PubMed

Publication types

MeSH terms