. 2013 Apr;88(1):203-18.
doi: 10.1111/mmi.12180. Epub 2013 Mar 11.

DNA methylation by CcrM activates the transcription of two genes required for the division of Caulobacter crescentus

Affiliations
Free PMC article

DNA methylation by CcrM activates the transcription of two genes required for the division of Caulobacter crescentus

Diego Gonzalez et al. Mol Microbiol. 2013 Apr.
Free PMC article

Abstract

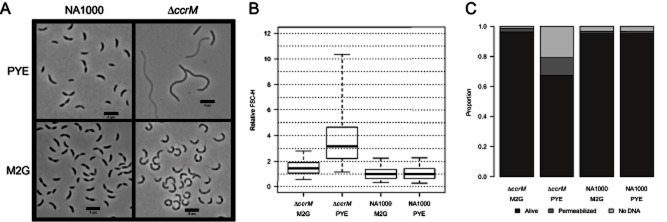
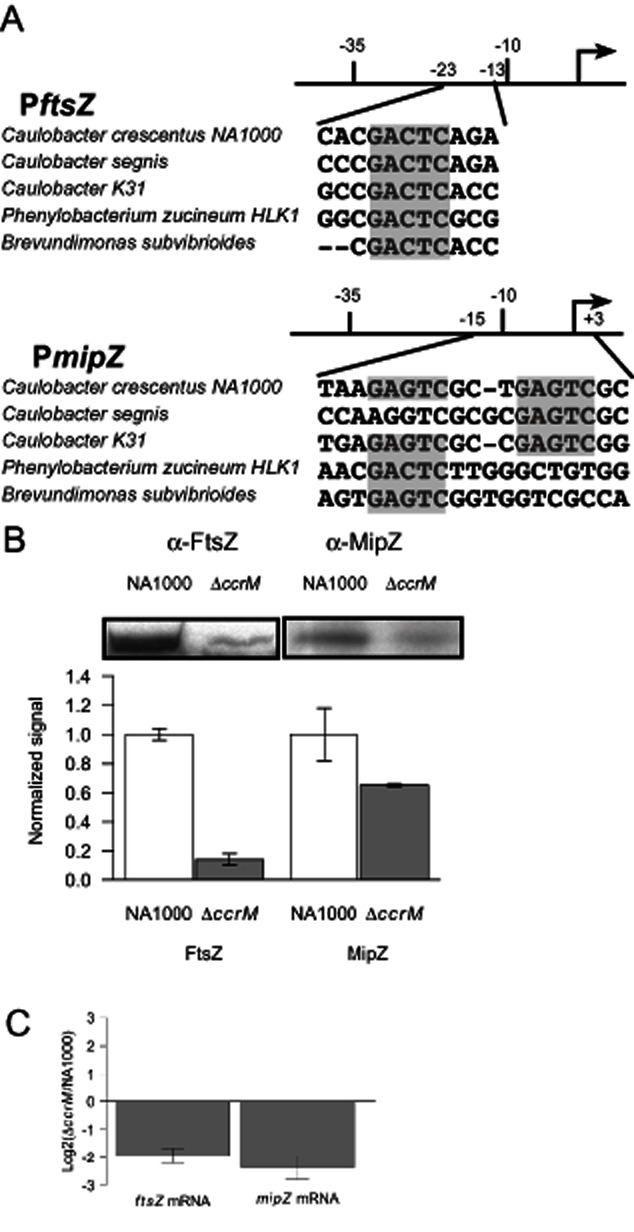
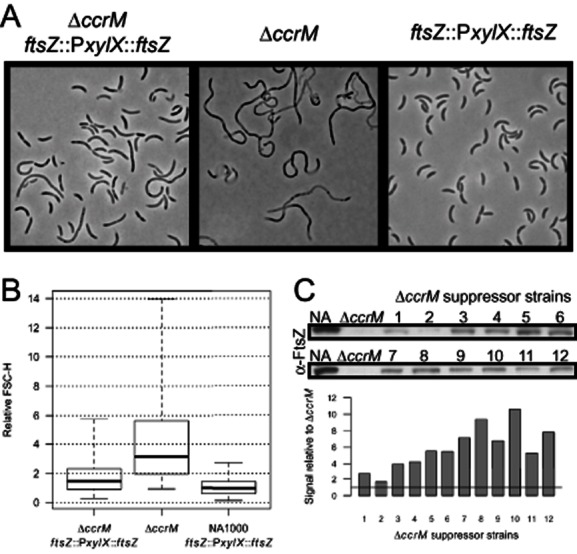
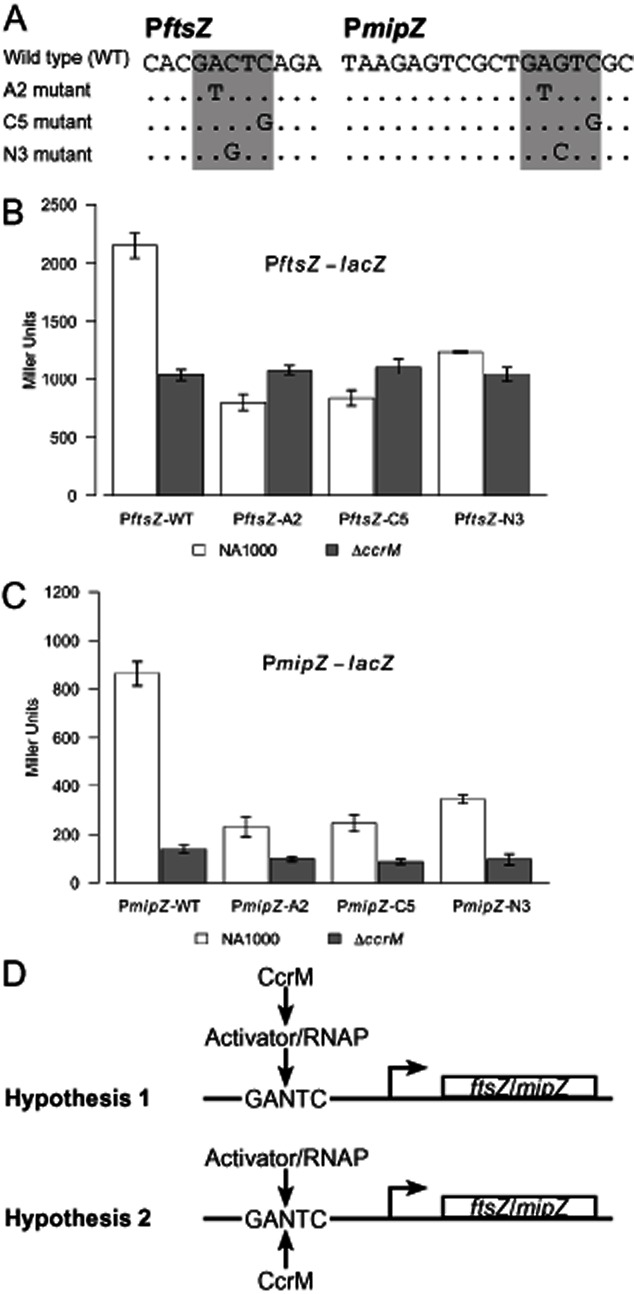
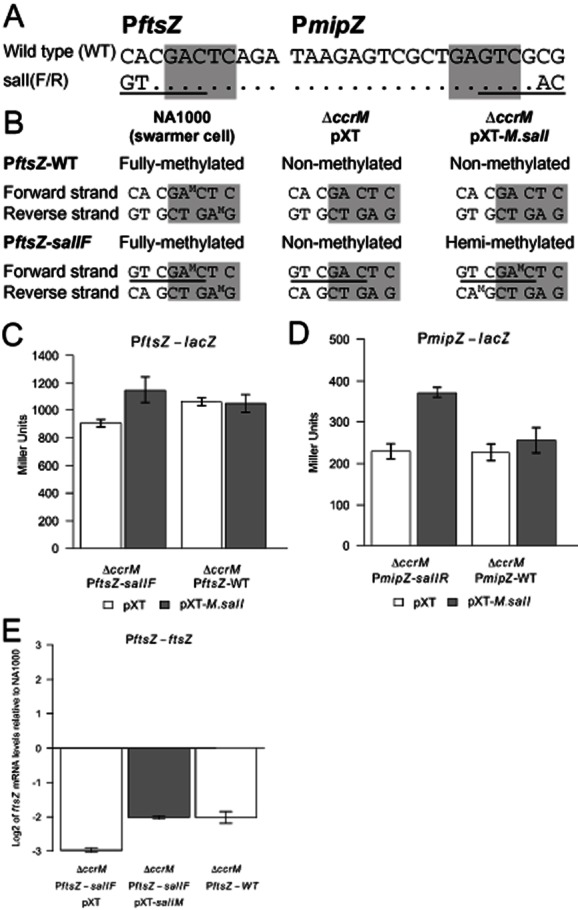
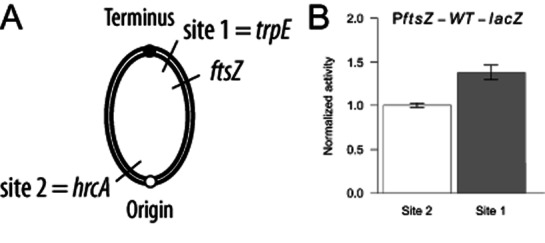
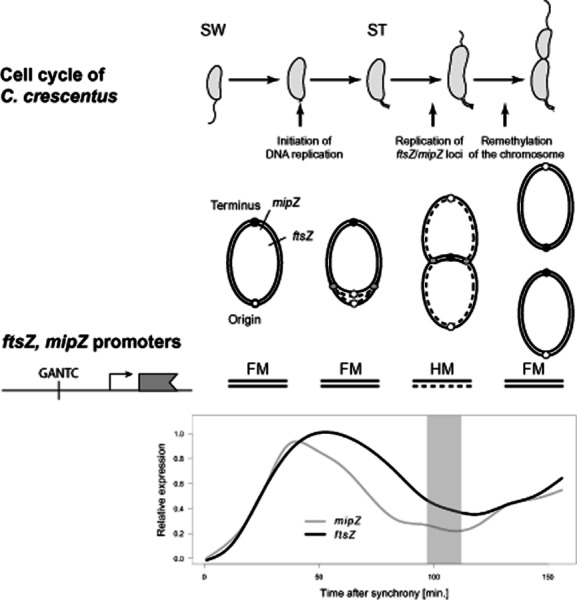
DNA methylation regulates many processes, including gene expression, by superimposing secondary information on DNA sequences. The conserved CcrM enzyme, which methylates adenines in GANTC sequences, is essential to the viability of several Alphaproteobacteria. In this study, we find that Caulobacter crescentus cells lacking the CcrM enzyme accumulate low levels of the two conserved FtsZ and MipZ proteins, leading to a severe defect in cell division. This defect can be compensated by the expression of the ftsZ gene from an inducible promoter or by spontaneous suppressor mutations that promote FtsZ accumulation. We show that CcrM promotes the transcription of the ftsZ and mipZ genes and that the ftsZ and mipZ promoter regions contain a conserved CGACTC motif that is critical to their activities and to their regulation by CcrM. In addition, our results suggest that the ftsZ promoter has the lowest activity when the CGACTC motif is non-methylated, an intermediate activity when it is hemi-methylated and the highest activity when it is fully methylated. The regulation of ftsZ expression by DNA methylation may explain why CcrM is essential in a subset of Alphaproteobacteria.


Figures

Fig. 1
Fig. 1
Cells lacking CcrM are elongated but nevertheless viable in minimal medium. NA1000 (wild-type) and JC1149 (ΔccrM) cells were harvested from exponential liquid cultures in rich (PYE) or minimal (M2G) media. A. Morphologies of the cells visualized by phase-contrast microscopy. The black bars are scales indicating 4 μm on the images. B. Cell size distributions in NA1000 and ΔccrM populations, as determined by flow cytometry. Forward scattering values (FSC-H) were used as an estimate of cell sizes. The median is shown as a bold line; the limits of the box are the first and the third quartile; the whiskers represent the 5% and 95% quantiles. A total of 20 000 cells were analysed for each population. C. Proportion of dead or damaged cells in NA1000 and ΔccrM populations. Cells were stained with 5 μg ml−1 propidium iodide (PI) and 5 μg ml−1 4′,6-diamidino-2-phenylindole (DAPI) and then visualized by fluorescence microscopy. Cells giving a signal for DAPI and not for PI were considered alive; cells giving a signal for PI were considered permeable; cells giving no signal with either DAPI or PI were considered as containing no DNA. More than 200 cells were analysed for each population.
Fig. 2
Fig. 2
Cells lacking CcrM accumulate low levels of ftsZ and mipZ mRNAs, leading to low levels of FtsZ and MipZ proteins. A. Schematics, partial sequences and phylogenetic conservation of the ftsZ and mipZ promoter regions containing conserved GANTC motifs. The schematics show the position of the GANTC motifs (highlighted in grey) upstream of the +1 transcription start sites (Kelly et al., ; McGrath et al., 2007). The multiple alignments below compare the promoter sequences surrounding the conserved GANTC motifs in Caulobacter crescentus, and in its four closest sequenced relatives Caulobacter segnis, Caulobacter K31, Phenylobacter zucineum and Brevundimonas subvibrioides. B. Immunoblot analysis comparing the intracellular levels of FtsZ (Mohl et al., 2001) and MipZ (Thanbichler and Shapiro, 2006) in NA1000 and JC1149 (ΔccrM) cells. Cells extracts were prepared from exponential phase cells cultivated in M2G medium. The graphs below the images show relative signal quantifications using images obtained using cell extracts from minimum two independent cultures; the normalization factor is the average of NA1000 signal quantification values for each protein. The OD660 was used to normalize the global protein content in each cell extract; to compensate for possible biases in OD660 values due to differences in cell shape and length, a stable non-specific protein signal also detected by immunoblot was used as a second normalization factor for the relative quantification of blots. C. Quantitative real-time PCR analysis comparing fstZ and mipZ mRNA levels in NA1000 cells compared with JC1149 cells. Cell extracts were prepared from cells cultivated in exponential phase in M2G medium. ftsZ and mipZ mRNA levels were quantified using NA1000 as the calibrator and the levels of the CC_3527 mRNA as an internal reference. The graph shows the log2 values of the average ratios of ftsZ or mipZ mRNA levels in JC1149 and NA1000 cells. Error bars correspond to the standard deviations from three independent biological samples for each strain.
Fig. 3
Fig. 3
ΔccrM cells expressing ftsZ from an inducible promoter are less elongated than ΔccrM cells. A. Phase-contrast microscopy images of JC1149 (ΔccrM), JC948 (ΔccrM ftsZ::PxylX::ftsZ) and YB1585 (ftsZ::PxylX::ftsZ) cells grown to exponential phase in PYE medium supplemented with 0.3% xylose (PYEX) to induce ftsZ expression. B. Cell size distributions in JC1149, JC948 and YB1585 populations cultivated to exponential phase in PYEX medium, as determined by flow cytometry. Forward scattering values (FSC-H) were used as an estimate of cell sizes. The median is shown as a bold line; the limits of the box are the first and the third quartile; the whiskers represent the 5% and 95% quantiles. A total of 20 000 cells were analysed for each population. C. Immunoblot analysis using FtsZ antibodies (Radhakrishnan et al., 2010) to estimate the intracellular levels of FtsZ in spontaneous suppressors of the ΔccrM strain (JC1149) cultivated at 22°C in rich medium. Suppressor strains used to prepare cell extracts were JC1228 (1), JC1229 (2), JC1232 (3), JC1233 (4), JC1230 (5), JC1231 (6), JC1224 (7), JC1225 (8), JC1226 (9), JC1227 (10), JC1223 (11) and JC1222 (12). Below the images of the immunoblots is a graph corresponding to the relative FtsZ protein levels: the signal of the immunoblot images was quantified and normalized using an image of a Coomassie blue-stained SDS-PAGE gel prepared using the same cell extracts. Results were further normalized so that estimated FtsZ levels were equivalent to 1 for the ΔccrM strain (straight line in the graph).
Fig. 4
Fig. 4
GANTC motifs found in the ftsZ and mipZ promoter regions are required for maximal ftsZ and mipZ transcription, in a CcrM-dependent manner. A. Schematics showing the point mutations introduced in the GANTC motifs (highlighted in grey) in the ftsZ and mipZ promoters fused to the lacZ gene in placZ290 derivatives. The A2 and C5 mutations prevent the methylation of the highlighted motif by CcrM. The N3 mutations do not affect the methylation of the highlighted GANTC motif by CcrM. B. The graph shows the β-galactosidase activities from placZ290-PftsZ-WT, placZ290-PftsZ-A5, placZ290-PftsZ-C5 and placZ290-PftsZ-N3 in NA1000 (wild-type) and JC1149 (ΔccrM) cells cultivated in exponential phase in M2G. The error bars indicate standard deviations from three independent experiments. C. The graph shows the β-galactosidase activities from placZ290-PmipZ-WT, placZ290-PmipZ-A5, placZ290-PmipZ-C5 and placZ290-PmipZ-N3 in NA1000 and JC1149 (ΔccrM) cells cultivated in exponential phase in M2G. The error bars indicate standard deviations from three independent experiments. D. These schematics depict two hypotheses compatible with the results that are shown in (B) and (C). According to Hypothesis 1, CcrM promotes the transcription of ftsZ or mipZ indirectly, by enhancing the synthesis or the activity of a direct activator of ftsZ or mipZ transcription or of an RNAP component. According to Hypothesis 2, CcrM promotes the transcription of ftsZ or mipZ by directly methylating their promoter regions and thereby promoting the binding or the activity of a direct activator of ftsZ or mipZ transcription or of an RNAP component.
Fig. 5
Fig. 5
The artificial hemi-methylation of GANTC sites in the ftsZ-salIF and mipZ-salIR promoters stimulates their activity in ΔccrM cells. A. Schematics showing the two-nucleotide mutations introduced next to the GANTC motifs (highlighted in grey) in the ftsZ and mipZ promoters. These mutations create a SalI methylation motif (GTCGAC sites, underlined) on the forward (F) strand of the ftsZ-salIF promoter and on the reverse (R) strand of the mipZ-salIR promoter. The GTCGAC motif overlaps but does not disrupts the GANTC motifs (highlighted in grey) from the ftsZ and mipZ promoters. B. Methylation states of the GANTC motif in PftsZ-WT and PftsZ-salIF in NA1000 (wild-type) and ΔccrM cells expressing (from pXT-M.salI) or not (pXT control vector) the M.SalI methyltransferase (strains JC1084, JC835, JC1147 and JC1127). AM corresponds to methylated adenines. The same principle applies to the mipZ promoter variants, except that the reverse strand of the GANTC site is methylated by the M.SalI methyltransferase, instead of the forward strand. C. The graph shows the β-galactosidase activities of extracts of ΔccrM cells containing placZ290-PftsZ-salIF or placZ290-PftsZ-WT and expressing (from pXT-M.salI) or not (pXT control vector) the M.SalI methyltransferase (strains JC1147 and JC1127 respectively). Cells were cultivated in exponential phase in M2G medium containing 0.06% of xylose to induce the expression of M.SalI. The error bars indicate standard deviations from six independent experiments. D. The graph shows the β-galactosidase activities from placZ290-PmipZ-salIR and placZ290-PmipZ-WT in ΔccrM cells expressing (from pXT-M.salI) or not (pXT control vector) the M.SalI methyltransferase (strains JC1147 and JC1127). Cells were cultivated in exponential phase in M2G medium containing 0.3% of xylose to induce M.SalI expression. The error bars indicate standard deviations from three independent experiments. E. Quantitative real-time PCR analysis comparing ftsZ mRNA levels in NA1000, JC1168 (ΔccrM PftsZ-salIF::ftsZ xylX::pXT), JC1169 (ΔccrM PftsZ-salIF::ftsZ xylX::pXT-M.salI) and JC1149 (ΔccrM) cells. Cell extracts were prepared from cells cultivated in exponential phase in M2G medium (strains NA1000 and JC1149) or in M2G medium containing 0.06% xylose (strains JC1168 and JC1169). ftsZ mRNA levels were quantified using NA1000 as the calibrator and the levels of the CC_3527 mRNA as an internal reference. The graph shows the log2 of the ratio of ftsZ mRNA levels in JC1168, JC1168 or JC1149, compared with the NA1000 strain. Error bars correspond to the standard deviations from three independent biological samples.
Fig. 6
Fig. 6
Activity of the ftsZ promoter integrated at different chromosomal loci. A. Schematic of the C. crescentus chromosome showing the positions of the origin, the terminus and the ftsZ, trpE (site 1) and hrcA (site 2) genes. B. Normalized activity of the PftsZ-WT promoter at site 1 and site 2. β-Galactosidase activities from PftsZ-WT-lacZ and PftsZ-C5-lacZ reporters in strains JC1269 (PftsZ-WT-lacZ at site 1), JC1271 (PftsZ-WT-lacZ at site 2), JC1270 (PftsZ-C5-lacZ at site 1) and JC1272 (PftsZ-C5-lacZ at site 2) cultivated in exponential phase in PYE medium were measured. The activities of PftsZ-WT at site 1 and at site 2 were corrected using the activities of PftsZ-C5 at the respective sites to compensate for effects due to copy number variation, and normalized so that the average activity of PftsZ-WT at site 2 equals 1. The plotted value for PftsZ-WT at site 1 equals (activity of PftsZ-WT at site 1/activity of PftsZ-C5 at site 1)/(activity of PftsZ-WT at site 2/activity of PftsZ-C5 at site 2). Error bars correspond to the standard deviations from three independent biological samples.
Fig. 7
Fig. 7
Schematic showing the cell cycle of C. crescentus, the methylation state of the chromosome and the temporal variations in ftsZ and mipZ mRNA levels. SW and ST indicate swarmer and stalked cells respectively. FM and HM indicate fully methylated and hemi-methylated DNA respectively. The relative expression (arbitrary units) of ftsZ and mipZ as a function of the cell cycle was estimated based on mRNA levels measured from a synchronized population of wild-type swarmer cells cultivated in M2G media (McGrath et al., 2007). The grey shade on the graph indicates the approximate period during which the ftsZ and mipZ promoters are hemi-methylated.

Similar articles

Cited by

References

    1. Adams DW, Errington J. Bacterial cell division: assembly, maintenance and disassembly of the Z ring. Nat Rev Microbiol. 2009;7:642–653. - PubMed
    1. Albu RF, Jurkowski T, Jeltsch A. The Caulobacter crescentus DNA-(adenine-N6)-methyltransferase CcrM methylates DNA in a distributive manner. Nucleic Acids Res. 2012;40:1708–1716. - PMC - PubMed
    1. Berdis AJ, Lee I, Coward JK, Stephens C, Wright R, Shapiro L, Benkovic SJ. A cell cycle-regulated adenine DNA methyltransferase from Caulobacter crescentus processively methylates GANTC sites on hemimethylated DNA. Proc Natl Acad Sci USA. 1998;95:2874–2879. - PMC - PubMed
    1. Bi EF, Lutkenhaus J. FtsZ ring structure associated with division in Escherichia coli. Nature. 1991;354:161–164. - PubMed
    1. Broadbent SE, Davies MR, van der Woude MW. Phase variation controls expression of Salmonella lipopolysaccharide modification genes by a DNA methylation-dependent mechanism. Mol Microbiol. 2010;77:337–353. - PMC - PubMed

Publication types

MeSH terms

Substances

LinkOut - more resources