

The global cardiovascular risk transition: associations of four metabolic risk factors with national income, urbanization, and Western diet in 1980 and 2008
- PMID: 23481623
- PMCID: PMC4181853
- DOI: 10.1161/CIRCULATIONAHA.113.001470
The global cardiovascular risk transition: associations of four metabolic risk factors with national income, urbanization, and Western diet in 1980 and 2008
Abstract
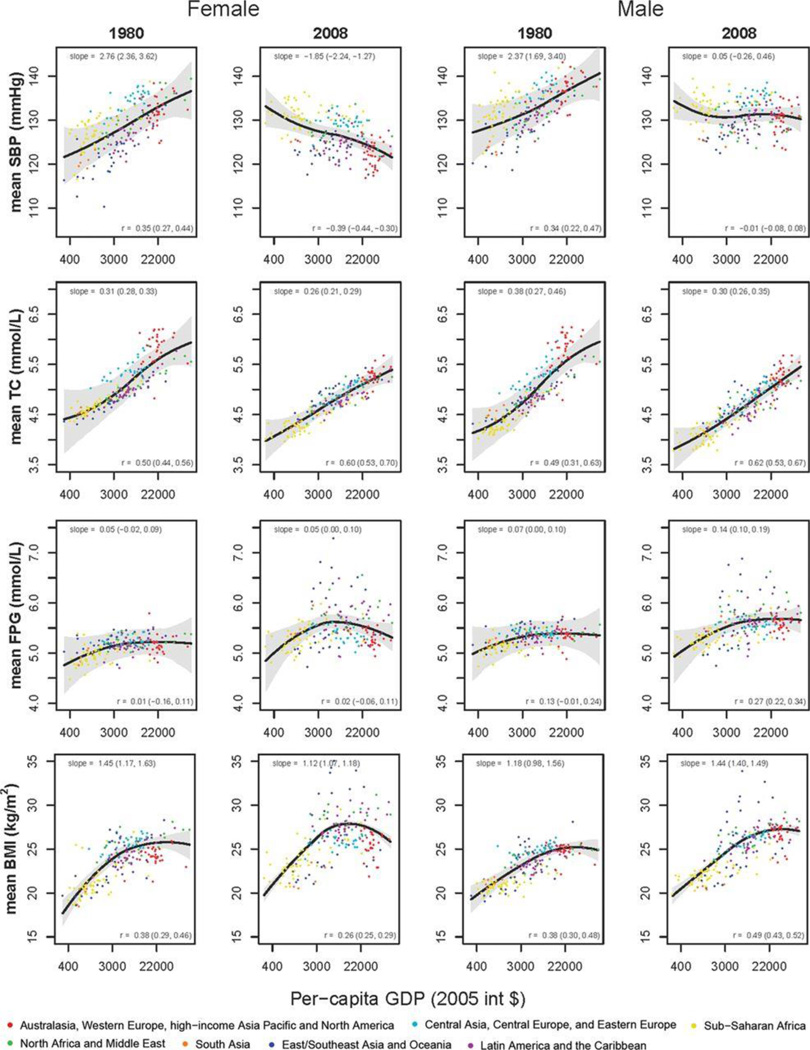
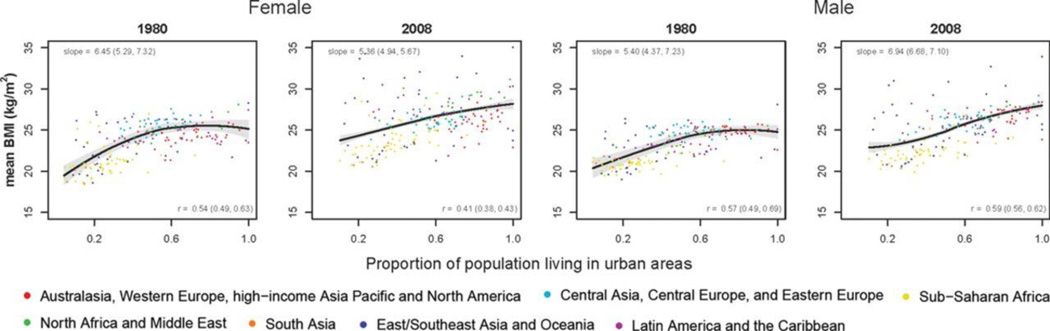
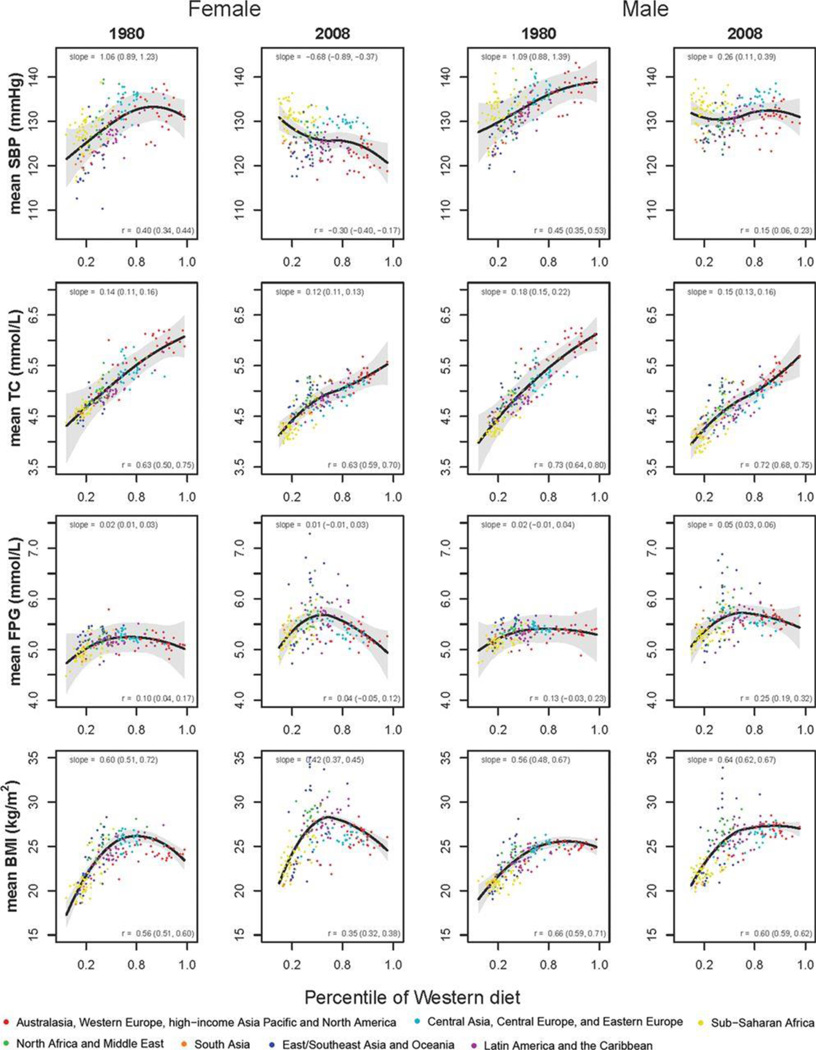
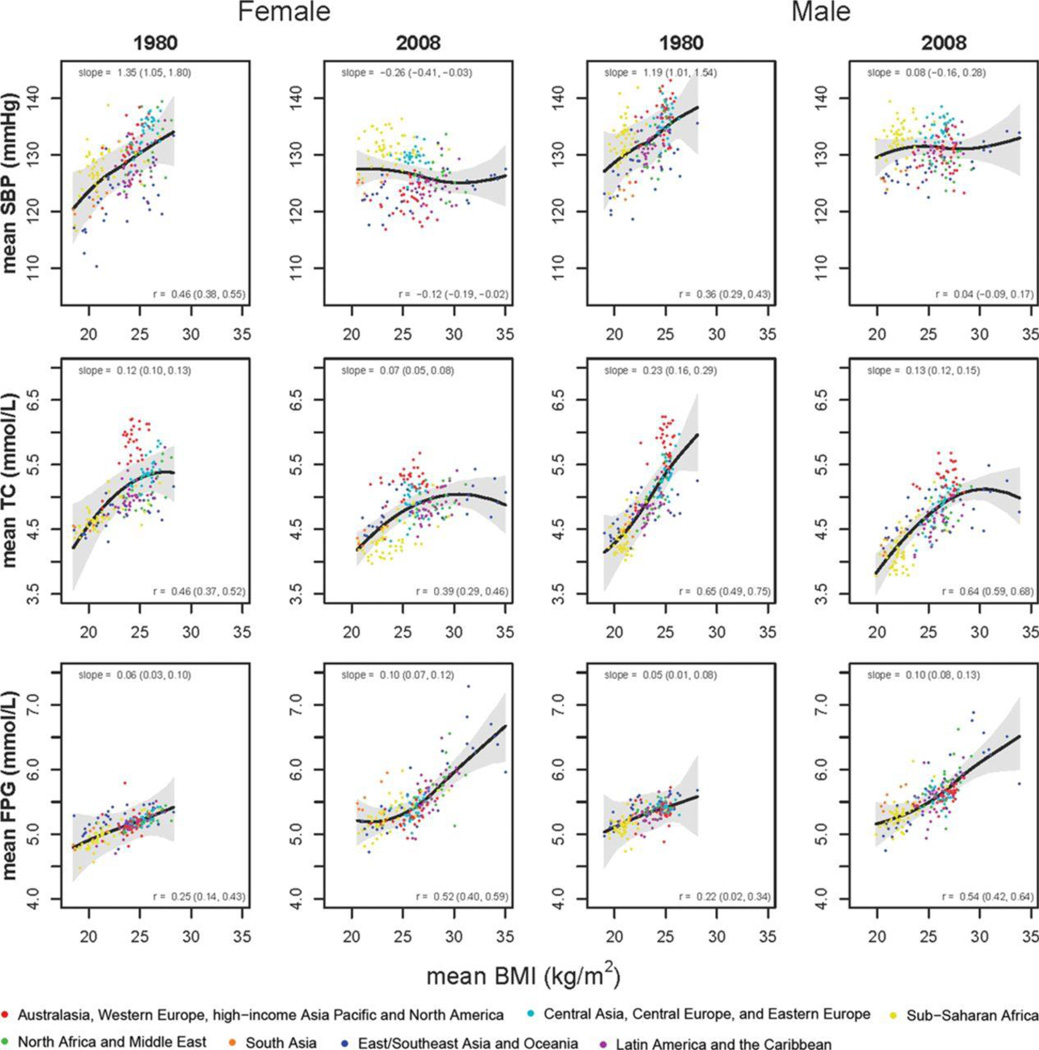
Background: It is commonly assumed that cardiovascular disease risk factors are associated with affluence and Westernization. We investigated the associations of body mass index (BMI), fasting plasma glucose, systolic blood pressure, and serum total cholesterol with national income, Western diet, and, for BMI, urbanization in 1980 and 2008.
Methods and results: Country-level risk factor estimates for 199 countries between 1980 and 2008 were from a previous systematic analysis of population-based data. We analyzed the associations between risk factors and per capita national income, a measure of Western diet, and, for BMI, the percentage of the population living in urban areas. In 1980, there was a positive association between national income and population mean BMI, systolic blood pressure, and total cholesterol. By 2008, the slope of the association between national income and systolic blood pressure became negative for women and zero for men. Total cholesterol was associated with national income and Western diet in both 1980 and 2008. In 1980, BMI rose with national income and then flattened at ≈Int$7000; by 2008, the relationship resembled an inverted U for women, peaking at middle-income levels. BMI had a positive relationship with the percentage of urban population in both 1980 and 2008. Fasting plasma glucose had weaker associations with these country macro characteristics, but it was positively associated with BMI.
Conclusions: The changing associations of metabolic risk factors with macroeconomic variables indicate that there will be a global pandemic of hyperglycemia and diabetes mellitus, together with high blood pressure in low-income countries, unless effective lifestyle and pharmacological interventions are implemented.
Conflict of interest statement
Figures
Comment in
-
Macroeconomics and cardiovascular risk factors: the same view through a different lens?Circulation. 2013 Apr 9;127(14):1451-2. doi: 10.1161/CIRCULATIONAHA.113.002002. Epub 2013 Mar 12. Circulation. 2013. PMID: 23481622 No abstract available.
References
-
- DiCesare M, Khang YH, Asaria P, Blakely T, Cowan MJ, Farzadfar F, Guerrero R, Ikeda N, Kyobutungi C, Msyamboza KP, Oum S, Lynch JW, Marmot MG, Ezzati M. Inequalities in non-communicable diseases and effective responses. Lancet. 2013 Feb 16;381:585–597. Epub 2013 Feb 12. - PubMed
-
- Kim D, Kawachi I, Hoorn SV, Ezzati M. Is inequality at the heart of it? Cross-country associations of income inequality with cardiovascular diseases and risk factors. Soc Sci Med. 2008;66:1719–1732. - PubMed
-
- Pelletier DL, Rahn M. Trends in body mass index in developing countries. Food and Nutrition Bulletin. 1998;19:223–239.
-
- Popkin BM. The shift in stages of the nutrition transition in the developing world differs from past experiences. Public Health Nutr. 2002;5:205–214. - PubMed
Publication types
MeSH terms
Substances
Grants and funding
LinkOut - more resources
Full Text Sources
Other Literature Sources
Medical
