

Elucidating the native sources of an invasive tree species, Acacia pycnantha, reveals unexpected native range diversity and structure
- PMID: 23482331
- PMCID: PMC3631341
- DOI: 10.1093/aob/mct057
Elucidating the native sources of an invasive tree species, Acacia pycnantha, reveals unexpected native range diversity and structure
Abstract
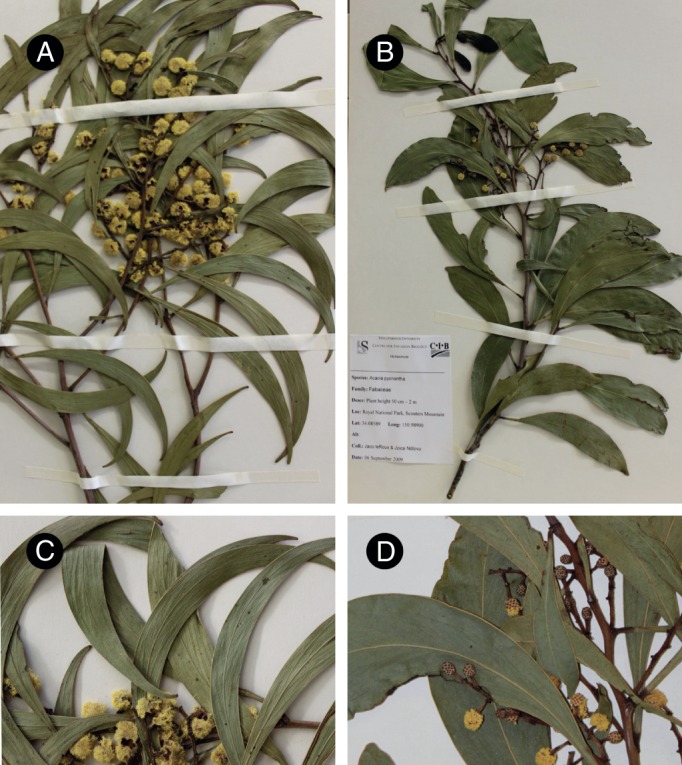
Background and aims: Understanding the introduction history of invasive plant species is important for their management and identifying effective host-specific biological control agents. However, uncertain taxonomy, intra- and interspecific hybridization, and cryptic speciation may obscure introduction histories, making it difficult to identify native regions to explore for host-specific agents. The overall aim of this study was to identify the native source populations of Acacia pycnantha, a tree native to south-eastern Australia and invasive in South Africa, Western Australia and Portugal. Using a phylogeographical approach also allowed an exploration of the historical processes that have shaped the genetic structure of A. pycnantha in its native range.
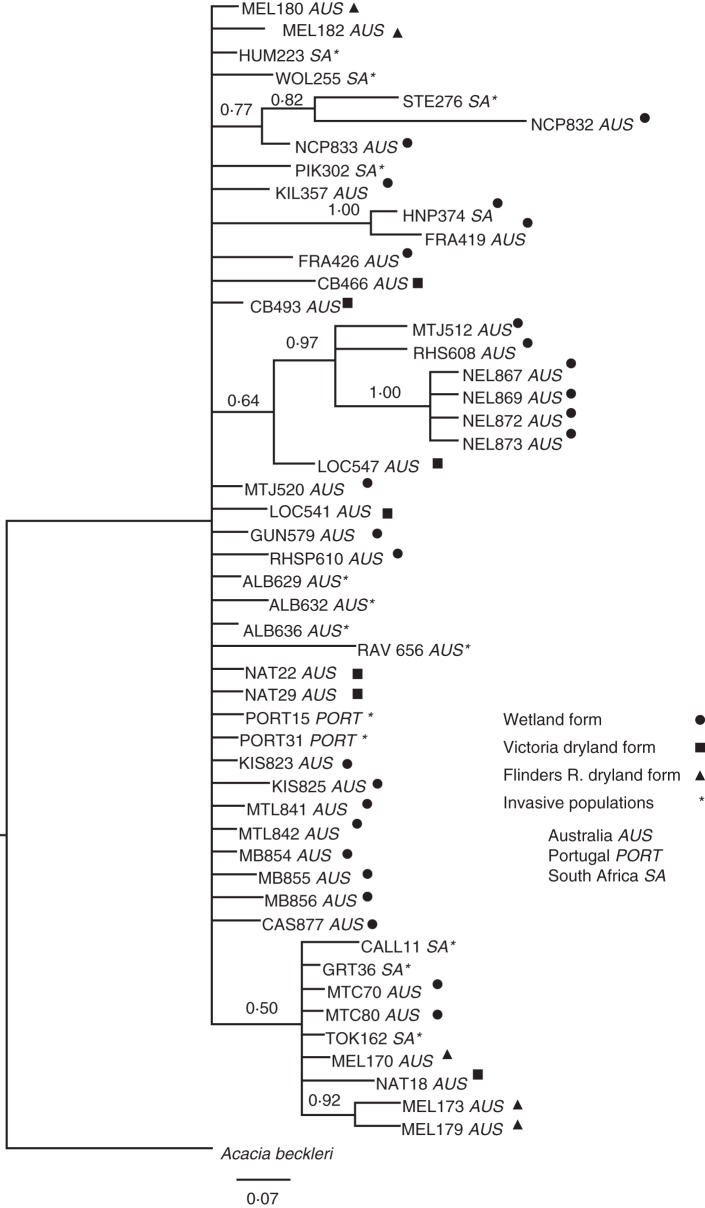
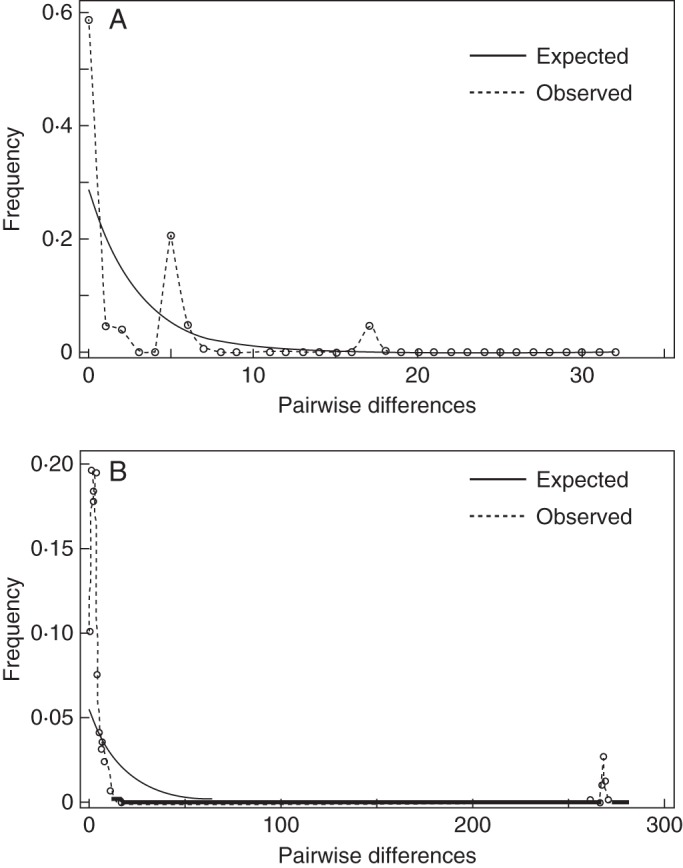
Methods: Nuclear (nDNA) and plastid DNA sequence data were used in network and tree-building analyses to reconstruct phylogeographical relationships between native and invasive A. pycnantha populations. In addition, mismatch distributions, relative rates and Bayesian analyses were used to infer recent demographic processes and timing of events in Australia that led to population structure and diversification.
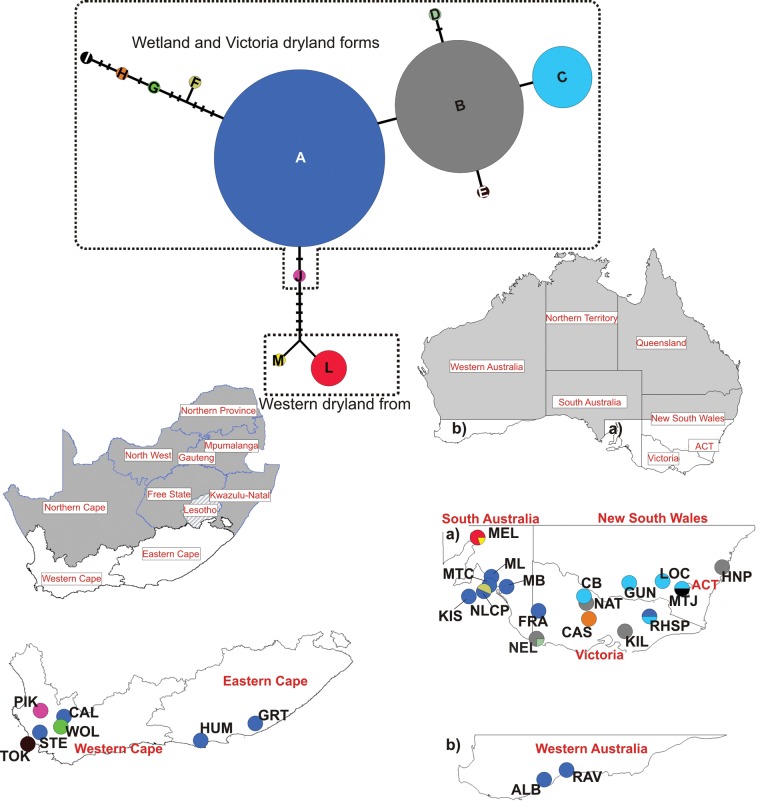
Key results: The plastid network indicated that Australian populations of A. pycnantha are geographically structured into two informally recognized lineages, the wetland and dryland forms, whereas the nuclear phylogeny showed little geographical structure between these two forms. Moreover, the dryland form of A. pycnantha showed close genetic similarity to the wetland form based on nDNA sequence data. Hybrid zones may explain these findings, supported here by incongruent phylogenetic placement of some of these taxa between nuclear and plastid genealogies.
Conclusions: It is hypothesized that habitat fragmentation due to cycles of aridity inter-dispersed with periods of abundant rainfall during the Pleistocene (approx. 100 kya) probably gave rise to native dryland and wetland forms of A. pycnantha. Although the different lineages were confined to different ecological regions, we also found evidence for intraspecific hybridization in Victoria. The invasive populations in Portugal and South Africa represent wetland forms, whereas some South African populations resemble the Victorian dryland form. The success of the biological control programme for A. pycnantha in South Africa may therefore be attributed to the fact that the gall-forming wasp Trichilogaster signiventris was sourced from South Australian populations, which closely match most of the invasive populations in South Africa.
Figures
References
-
- Bossdorf O, Auge H, Lafuma L, Rogers WE, Siemann E, Pratti D. Phenotypic and genetic differentiation between native and introduced plant populations. Oecologia. 2005;144:1–11. - PubMed
-
- Byrne M, Macdonald B, Coates D. Phylogeographical patterns in chloroplast DNA variation within Acacia acuminata (Leguminosae: Mimosoideae) complex in Western Australia. Journal of Evolutionary Biology. 2002;15:576–587.
-
- Byrne M, Macdonald B, Brand J. Phylogeography and divergence in the chloroplast genome of Western Australian sandalwood (Santalum spicatum) Heredity. 2003;91:389–395. - PubMed
-
- Charif D, Lobry JR. New York: Springer; 2007. SeqinR 1·0-2: a contributed package to the R project for statistical computing devoted to biological sequences retrieval and analysis. Structural approaches to sequence evolution: molecules, networks, populations; pp. 207–232.
-
- Clement M, Posada D, Crandall K. TCS: a computer program to estimate gene genealogies. Molecular Ecology. 2000;9:1657–1660. - PubMed
Publication types
MeSH terms
LinkOut - more resources
Full Text Sources
Other Literature Sources
