. 2013 Apr;140(7):1433-44.
doi: 10.1242/dev.087551.

Single-cell gene expression profiling reveals functional heterogeneity of undifferentiated human epidermal cells

Affiliations

Single-cell gene expression profiling reveals functional heterogeneity of undifferentiated human epidermal cells

David W M Tan et al. Development. 2013 Apr.

Abstract

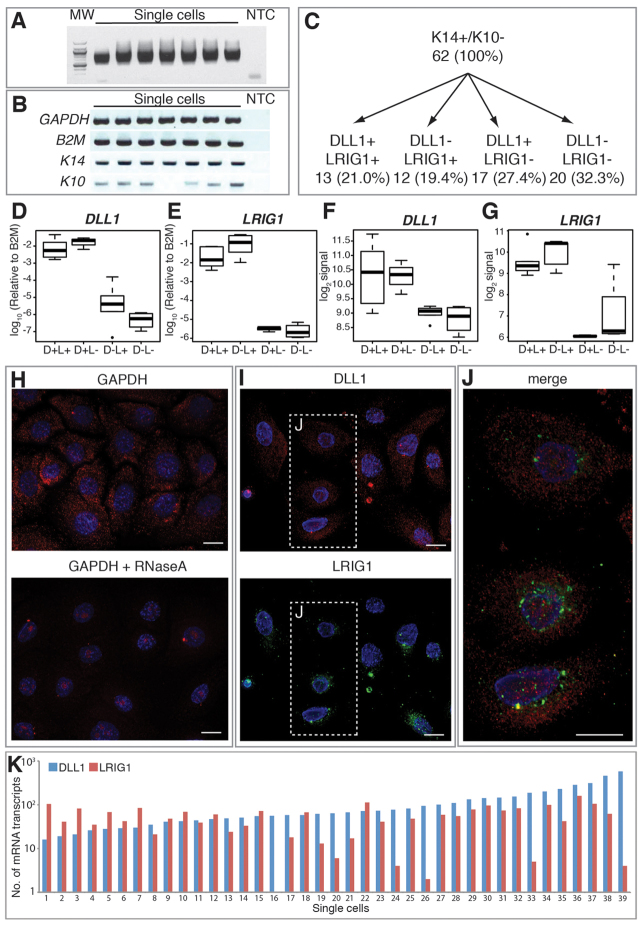
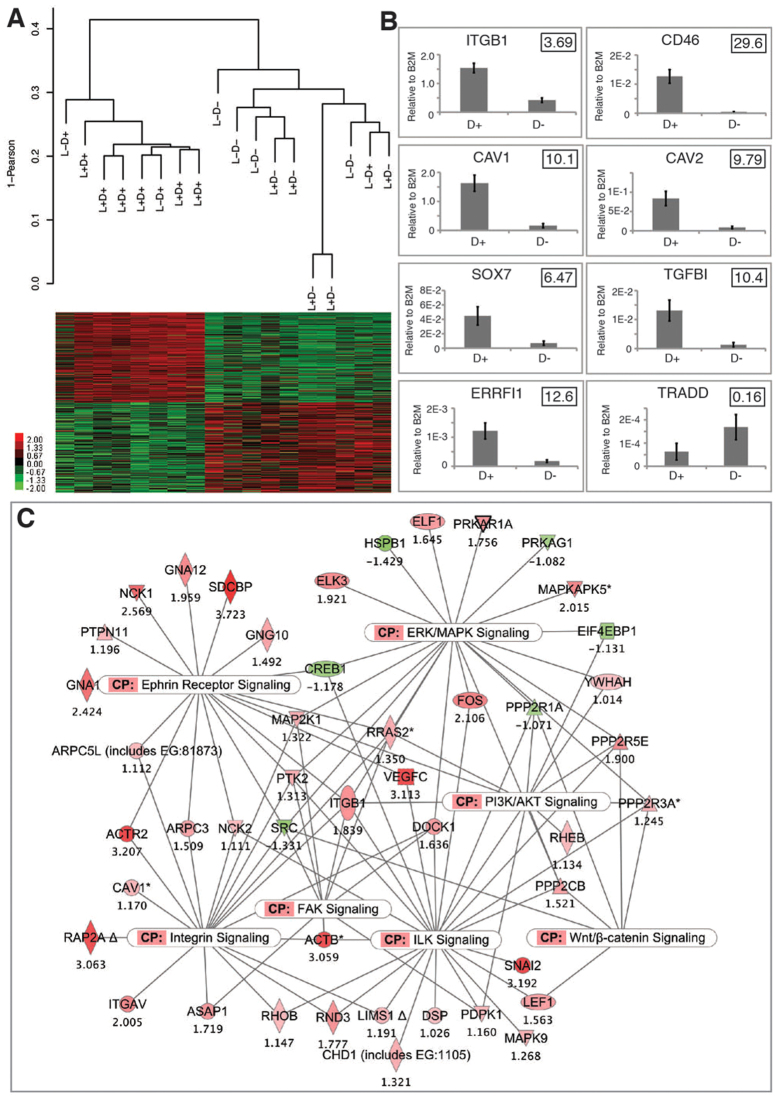
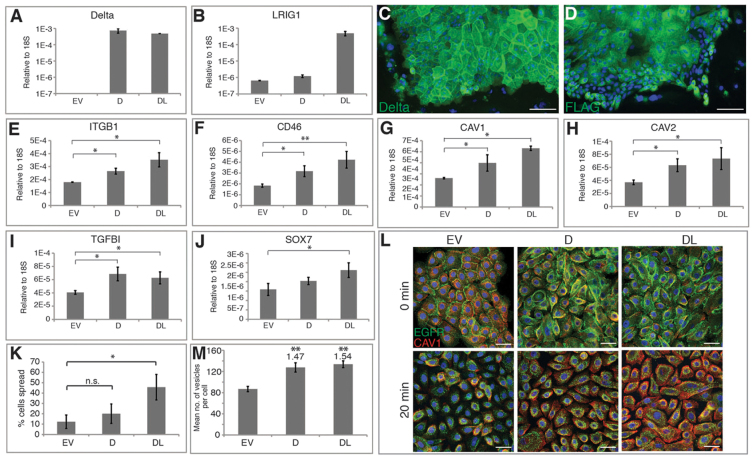
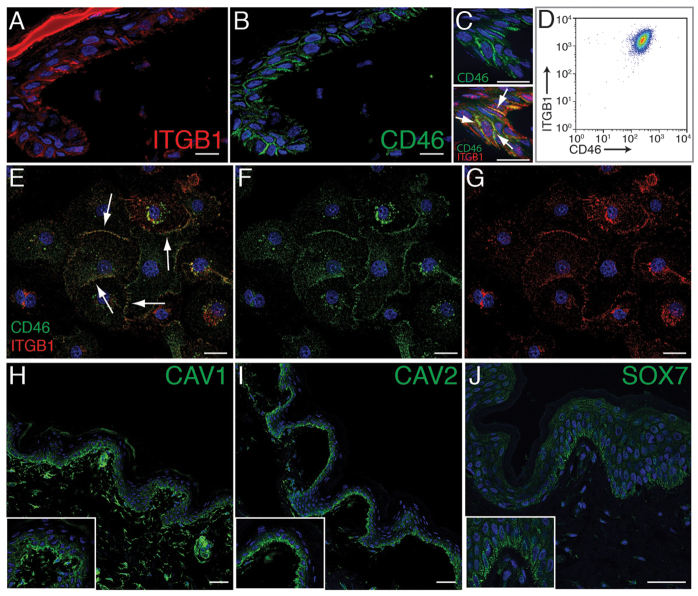
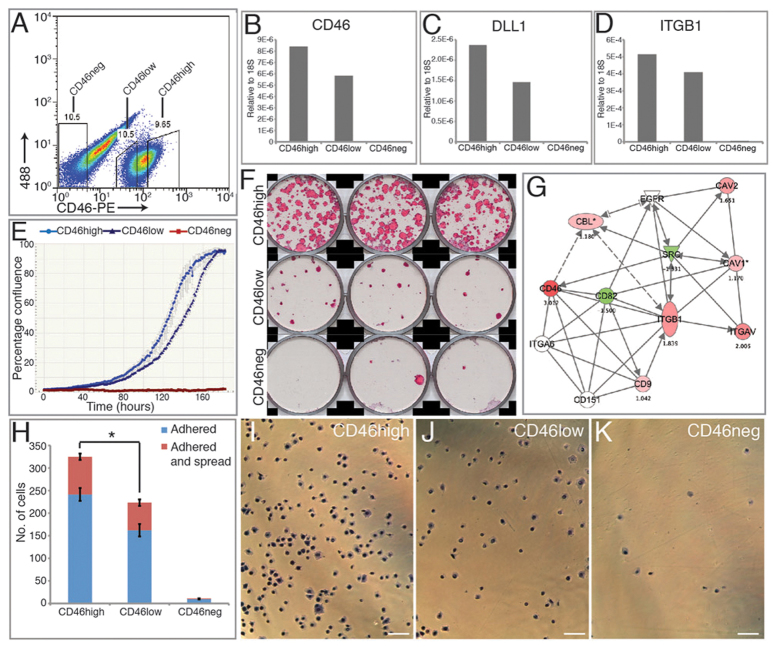
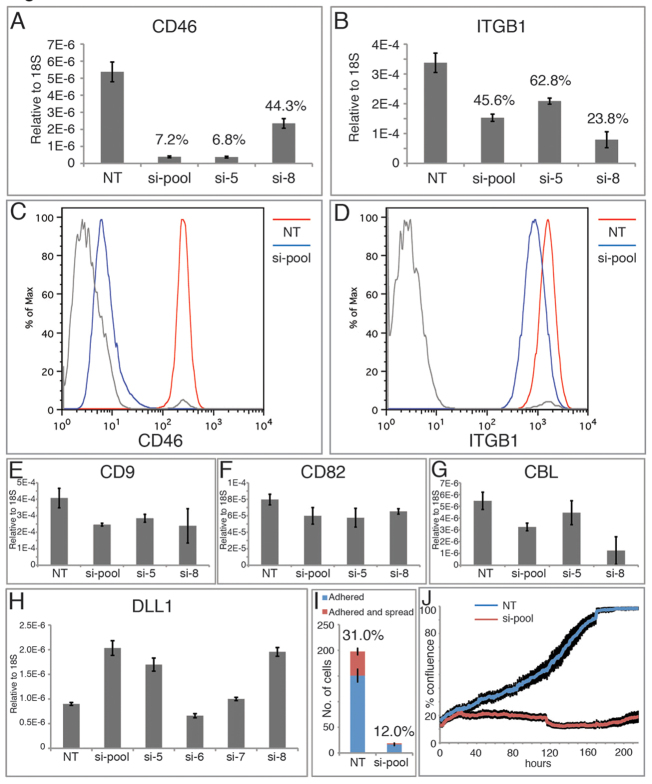
Human epidermal stem cells express high levels of β1 integrins, delta-like 1 (DLL1) and the EGFR antagonist LRIG1. However, there is cell-to-cell variation in the relative abundance of DLL1 and LRIG1 mRNA transcripts. Single-cell global gene expression profiling showed that undifferentiated cells fell into two clusters delineated by expression of DLL1 and its binding partner syntenin. The DLL1(+) cluster had elevated expression of genes associated with endocytosis, integrin-mediated adhesion and receptor tyrosine kinase signalling. Differentially expressed genes were not independently regulated, as overexpression of DLL1 alone or together with LRIG1 led to the upregulation of other genes in the DLL1(+) cluster. Overexpression of DLL1 and LRIG1 resulted in enhanced extracellular matrix adhesion and increased caveolin-dependent EGFR endocytosis. Further characterisation of CD46, one of the genes upregulated in the DLL1(+) cluster, revealed it to be a novel cell surface marker of human epidermal stem cells. Cells with high endogenous levels of CD46 expressed high levels of β1 integrin and DLL1 and were highly adhesive and clonogenic. Knockdown of CD46 decreased proliferative potential and β1 integrin-mediated adhesion. Thus, the previously unknown heterogeneity revealed by our studies results in differences in the interaction of undifferentiated basal keratinocytes with their environment.


Figures

Fig. 1.
Fig. 1.
Modification and optimisation of the single-cell PCR method. (A) Overview of the single-cell PCR method. (B,C) Electropherogram profiles of cRNA produced by an in vitro transcription (IVT) incubation of 16 (B) or 6 (C) hours. The standard 16-hour (overnight) IVT incubation produced samples that differed from the originals according to the bioanalyser traces (B). Our single-cell cDNA library method produces cDNA transcripts of only 500 to 1000 bp, which differs from standard reverse-transcribed total RNA samples that vary in transcript length. An IVT incubation of 6 hours (C) was optimal to obtain sufficient labelled cRNA with similar profiles to the original cDNA samples. The three samples are from individual single-cell cRNA libraries. The ladder shown is a RNA 6000 ladder (Agilent); the numbers indicate the size (in bases) of the RNA bands. FU, fluorescence units.
Fig. 2.
Fig. 2.
Validation of the single-cell PCR method. (A) Expression values of cDNA generated from 100 ng total RNA plotted against expression values of cDNA generated and amplified from 50 pg, 10 pg and 1 pg total RNA. Correlation coefficient (R2) values were 0.978, 0.925 and 0.970, respectively. Thus, linearity of relative transcript abundance was well preserved. (B) Addition of exogenous spike RNAs from Arabidopsis thaliana (LTP4, LTP6, NAC1, TIM) allows detection of transcripts of known copy number as an exogenous amplification control (Osawa et al., 2005). The spike RNA samples were diluted to known quantities and added to the first-strand synthesis buffer. Analysing the relative spike cDNA transcript levels after amplification showed that linearity was preserved in samples starting with 50 pg, 10 pg and 1 pg total RNA, where R2 values were 0.994, 0.997 and 0.920, respectively. The spike RNA samples had been diluted to a concentration corresponding to ∼40,000, 4000, 400 and 40 copies, respectively. Detection of 40 copies of a spike RNA demonstrates the sensitivity of the method for amplifying low-abundance transcripts. (C,D) Relative gene expression values of housekeeping genes (ACTB and GAPDH), markers of basal cells (K14, ITGB1) and differentiated cells (K10 and IVL) as measured by QPCR (C) and obtained from Illumina BeadArrays (D). Data show mean ± s.e.m.
Fig. 3.
Fig. 3.
Heterogeneous expression of stem cell markers at the single-cell level. (A) Seven single-cell cDNA libraries run on a 2% agarose gel show a smear of cDNA between 500 and 1000 bp. MW, molecular weight marker; NTC, no template control. (B) Marker expression in single-cell cDNA libraries determined by PCR. (C) Heterogeneous expression of DLL1 and LRIG1 in 62 single-cell cDNA libraries from keratinocytes that were K14 positive and K10 negative. (D,E) Relative gene expression values measured by QPCR for DLL1 (D) and LRIG1 (E). (F,G) Relative gene expression values obtained from Illumina BeadArrays for DLL1 (F) and LRIG1 (G). (H) Single-molecule RNA FISH with the GAPDH probe set. RNaseA treatment before probe hybridisation removes the cytoplasmic signal. (I) Simultaneous detection of DLL1 and LRIG1 mRNA by single-molecule RNA FISH shows cells with different levels of each type of transcript. (J) Merged image of boxed region in I at higher magnification. (K) Number of DLL1 and LRIG1 mRNA transcripts per cell in 39 single keratinocytes, ordered by level of DLL1 expression. Data show mean ± s.e.m. Scale bars: 20 μm.
Fig. 4.
Fig. 4.
Global gene expression profiling of single epidermal stem cells. (A) Unsupervised hierarchical clustering of 18 single-cell cDNA libraries and heatmap of differential gene expression of 2080 genes between the two clusters. D, DLL1; L, LRIG1. (B) QPCR expression data for eight genes identified from the microarrays. Fold-change values obtained from Illumina BeadArrays are displayed in boxes in the upper right-hand corner. Data show mean ± s.e.m. (C) IPA analysis showing canonical signalling pathway (CP) genes that were differentially expressed between the two clusters. Log2 fold-change values (D+ cluster compared with D-cluster) are shown below coloured nodes.
Fig. 5.
Fig. 5.
Stem cell markers are not independently regulated. (A,B) QPCR expression data for zebrafish delta (A) and LRIG1 (B) in keratinocytes retrovirally infected with delta alone (D) or together with LRIG1 (DL); control cells were infected with empty vector (EV). (C,D) Immunostaining for zebrafish Delta (C, green) and FLAG (D, green) with DAPI counterstain (blue). (E-J) QPCR expression data for six genes identified as upregulated in D+ cells. n=4 experiments. *P<0.05; **P<0.01. (K) Quantitation of percentage spread cells after adhesion to type I collagen for 30 minutes. n=3 experiments. *P=0.0418 for DL; n.s.: not significant. (L) Immunostaining for EGFR (green) and CAV1 (red) with DAPI nuclear counterstain (blue). Cells were serum starved (0 minute) or treated with EGF for 20 minutes. (M) Quantitation of vesicles in L. n=3 experiments. Values above columns indicate fold-change compared with empty vector (EV) control. **P=0.00229 for D, **P=0.00828 for DL. Data are mean ± s.e.m. Scale bars: 50 μm.
Fig. 6.
Fig. 6.
Epidermal expression of CD46, CAV1, CAV2 and SOX7. (A-C) Immunofluorescence staining of CD46 (green) and ITGB1 (red) in human abdomen skin. The same field is shown in A and B. (C) High magnification view of the epidermal basal layer showing CD46 (green) only (top) or double labelling for ITGB1 (red) (bottom). Arrows indicate co-expression of CD46 and ITGB1 at cell-cell junctions. (D) Flow cytometry dot plot showing co-expression of CD46 and ITGB1 in cultured primary human keratinocytes gated on the basis of low forward and side scatter (undifferentiated cells). (E-G) Immunofluorescence staining of CD46 (green) and ITGB1 (red) in cultured primary human keratinocytes showing colocalisation at cell-cell junctions (arrows). (E) Merged of F and G. (H-J) Immunofluorescence staining for CAV1 (H), CAV2 (I) and SOX7 (J) in adult human abdomen skin showing positive staining in the basal epidermal layer (green). Insets show higher magnification views of basal layer staining. Cells and sections were counterstained with DAPI (blue). Scale bars: 50 μm in A-C; 10 μm in E-G; 100 μm in H-J.
Fig. 7.
Fig. 7.
High cell surface levels of CD46 enrich for epidermal stem cells. (A) Flow cytometry dot plot of undifferentiated keratinocytes (low forward and side scatter) showing gates for isolating cells with high (CD46high), low (CD46low) and no (CD46neg) surface levels of CD46. (B-D) QPCR quantitation of mRNA levels of CD46 (B), DLL1 (C) and ITGB1 (D) in one experiment, representative of three independent experiments, showing enrichment of stem cell marker genes in the CD46high population. (E) Growth curves obtained in an IncuCyte system. (F) Clonal growth assays, representative of four independent experiments. (G) Ingenuity network analysis showing relationship between CD46 and genes that regulate β1 integrin-mediated adhesion and EGFR signalling. Green represents downregulation and red represents upregulation in D+ compared with D-cells (log2-fold change values are shown below coloured nodes). (H) Quantitation of adherent and spread cells following plating on type I collagen for 30 minutes. Data are mean ± s.e.m., n=3. *P=0.0182. (I-K) Representative images of adherent and spread cells. Scale bars: 50 μm.
Fig. 8.
Fig. 8.
siRNA-mediated knockdown of CD46 decreases proliferation and β1 integrin-mediated adhesion. (A,B) QPCR quantitation of CD46 (A) and ITGB1 (B) mRNA levels after siRNA-mediated knockdown of CD46. n=4. NT, non-targeting control; si-pool, pool of four different siRNAs against CD46; si-5 and si-8, two individual siRNAs against CD46. Values shown above each column indicate percentage expression that remains 72 hours post-treatment. (C,D) Cell surface levels of CD46 (C) and ITGB1 (D) determined by flow cytometry of undifferentiated cells (low forward and side scatter). Grey lines, negative control. (E-H) QPCR quantitation of CD9 (E), CD82 (F), CBL (G) and DLL1 (H) mRNA levels 72 hours post-CD46 knockdown. n=4. (I) Quantitation of adherent and spread cells following plating on type I collagen for 30 minutes. n=3. (J) Effect of CD46 knockdown on growth curves. Data are mean ± s.e.m.

References

    1. Adams J. C., Watt F. M. (1989). Fibronectin inhibits the terminal differentiation of human keratinocytes. Nature 340, 307–309 - PubMed
    1. Barrandon Y., Green H. (1987). Three clonal types of keratinocyte with different capacities for multiplication. Proc. Natl. Acad. Sci. USA 84, 2302–2306 - PMC - PubMed
    1. Bauwens C. L., Song H., Thavandiran N., Ungrin M., Massé S., Nanthakumar K., Seguin C., Zandstra P. W. (2011). Geometric control of cardiomyogenic induction in human pluripotent stem cells. Tissue Eng. Part A 17, 1901–1909 - PubMed
    1. Beekman J. M., Coffer P. J. (2008). The ins and outs of syntenin, a multifunctional intracellular adaptor protein. J. Cell Sci. 121, 1349–1355 - PubMed
    1. Campos L. S., Decker L., Taylor V., Skarnes W. (2006). Notch, epidermal growth factor receptor, and beta1-integrin pathways are coordinated in neural stem cells. J. Biol. Chem. 281, 5300–5309 - PubMed

Publication types

MeSH terms