. 2013 Apr;140(7):1517-27.
doi: 10.1242/dev.087593.

Intradermal adipocytes mediate fibroblast recruitment during skin wound healing

Affiliations

Intradermal adipocytes mediate fibroblast recruitment during skin wound healing

Barbara A Schmidt et al. Development. 2013 Apr.

Abstract

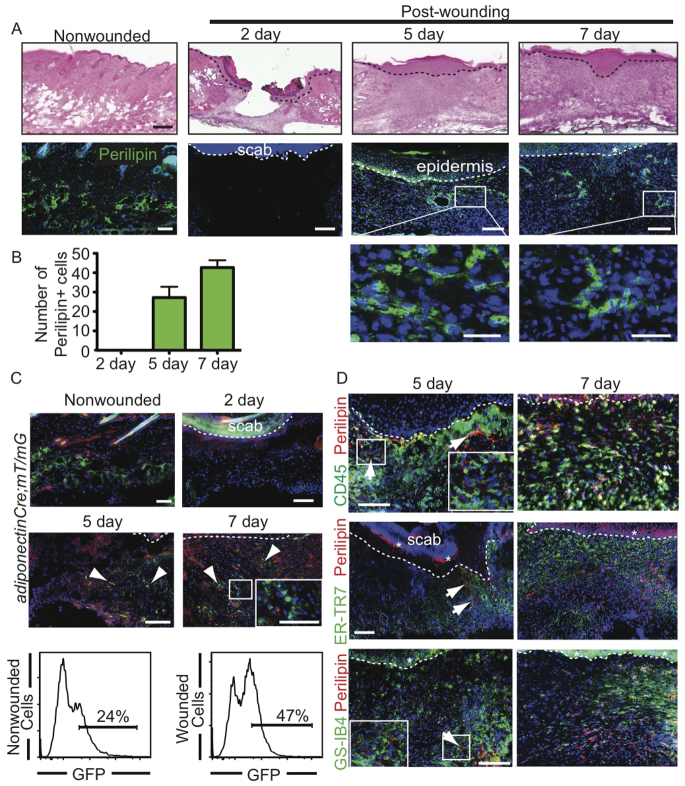
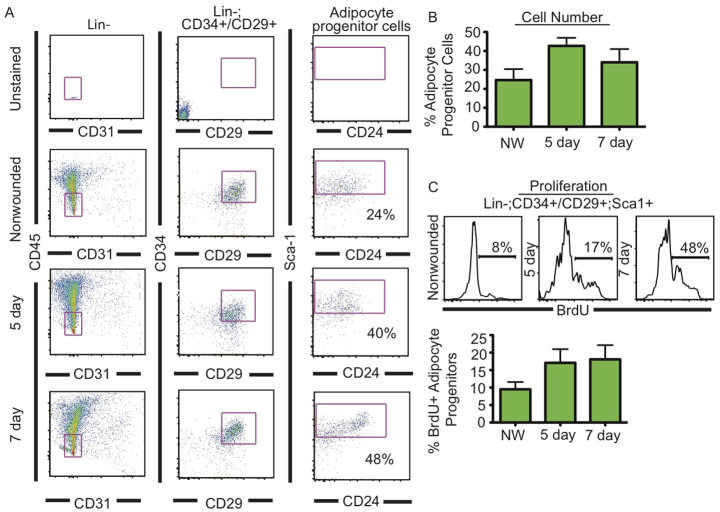
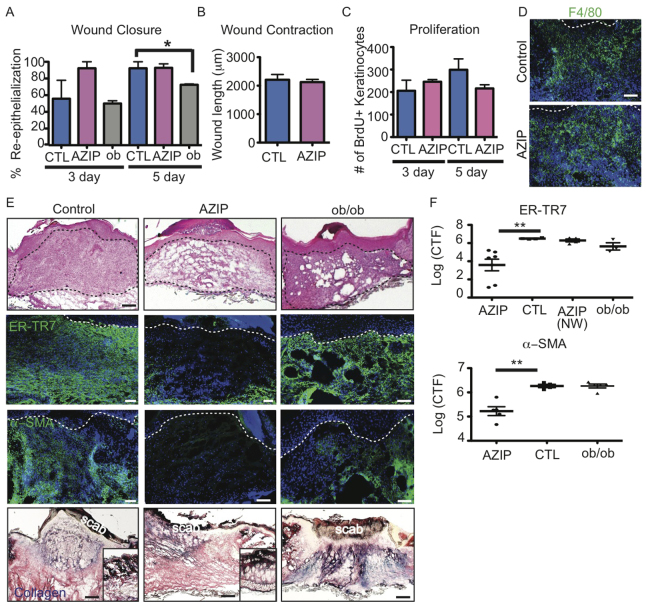
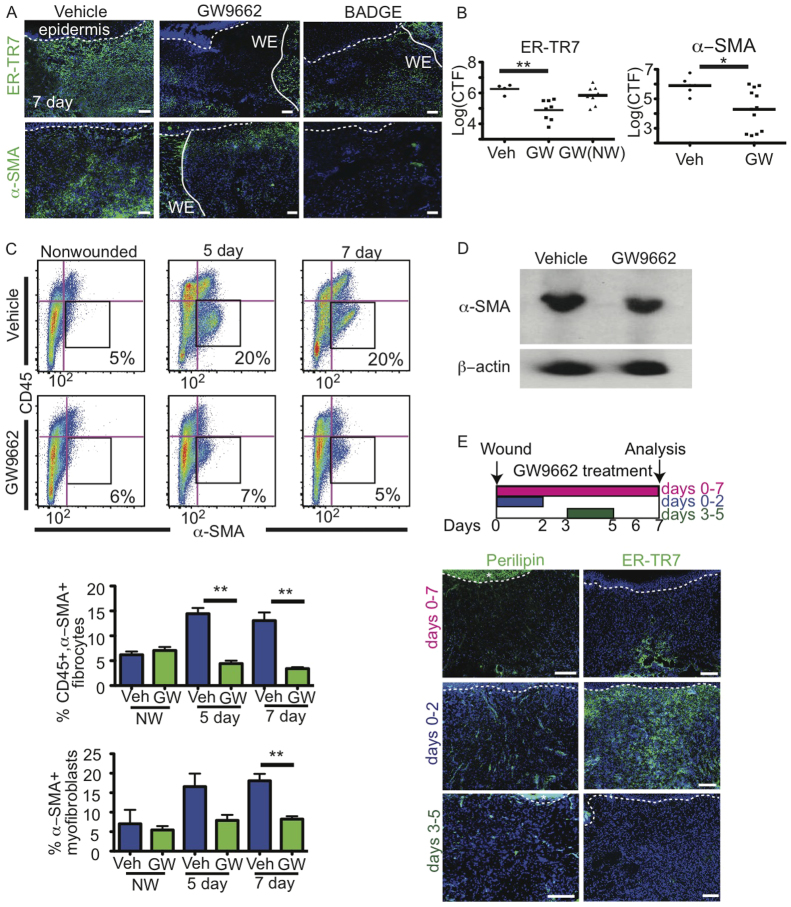
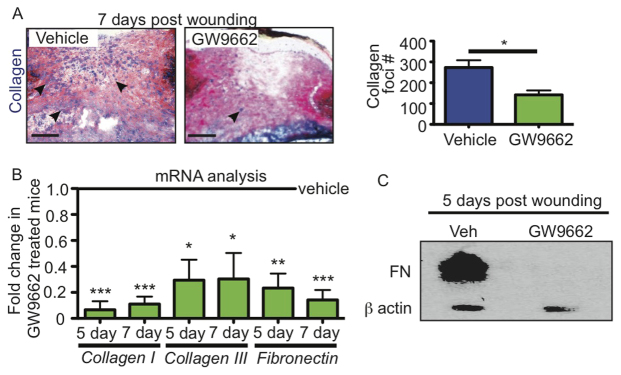
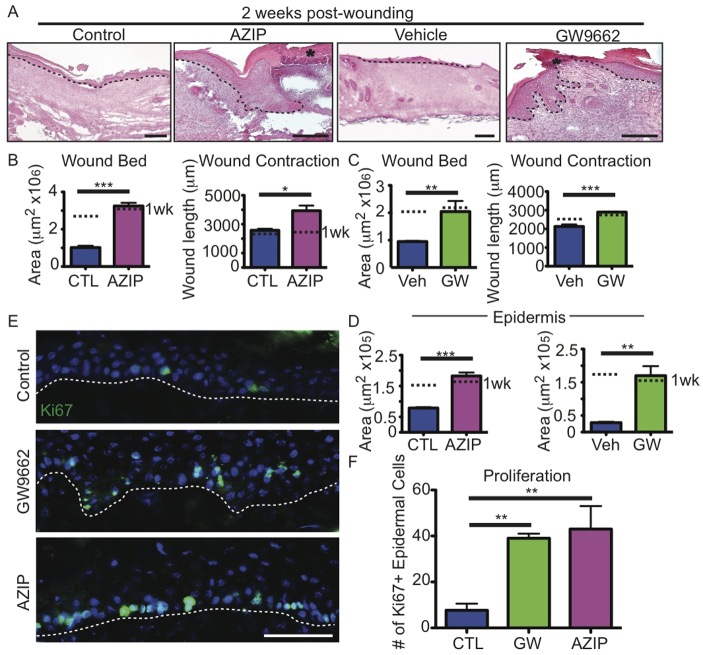
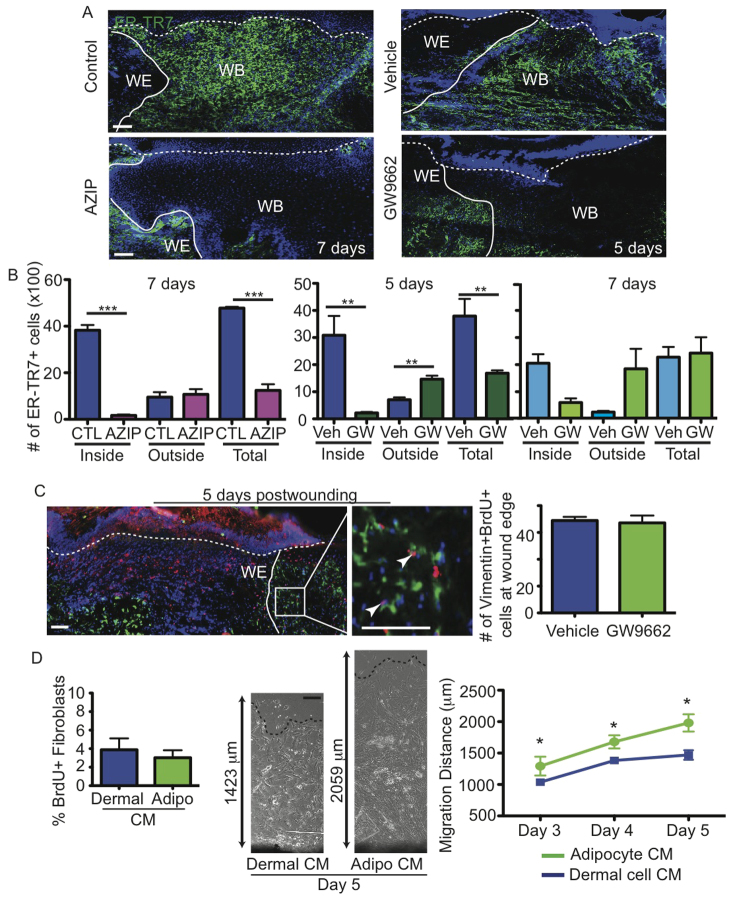
Acute wound healing in the skin involves the communication of multiple cell types to coordinate keratinocyte and fibroblast proliferation and migration for epidermal and dermal repair. Many studies have focused on the interplay between hematopoietic cells, keratinocytes and fibroblasts during skin wound healing, yet the possible roles for other cell types within the skin, such as intradermal adipocytes, have not been investigated during this process. Here, we identify that adipocyte lineage cells are activated and function during acute skin wound healing. We find that adipocyte precursor cells proliferate and mature adipocytes repopulate skin wounds following inflammation and in parallel with fibroblast migration. Functional analysis of mice with defects in adipogenesis demonstrates that adipocytes are necessary for fibroblast recruitment and dermal reconstruction. These data implicate adipocytes as a key component of the intercellular communication that mediates fibroblast function during skin wound healing.


Figures

Fig. 1.
Fig. 1.
Adipocytes repopulate skin wounds. (A) Histological analysis of adipocyte formation during wound healing. Skin sections stained with Hematoxylin and Eosin (H&E) reveal wound histology (top row). Immunostaining with antibodies against perilipin A (green) reveals the presence of adipocytes within wounds at 5 and 7 days (middle and bottom rows). Dotted line indicates the epidermis/dermis boundary. Asterisk indicates background fluorescent staining. The boxed areas are magnified beneath. (B) Quantitation of perilipin+ cells in wound beds at 2, 5 and 7 days after wounding. Mature adipocyte number increases as wounds heal. n=4 wounds for each bar per mouse from three mice. Error bars indicate s.e.m. (C) Wounds from adiponectinCre; mT/mG mice at 2, 5 and 7 days after wounding show GFP+ cells (arrowheads) in the wound bed at 5 and 7 days. Inset shows magnification of boxed area within the same panel. The flow cytometry plots show GFP fluorescence in dermal cells isolated from adiponectinCre; mT/mG mice 5 days after wounding or in non-wounded skin. (D) Five days after wounding, perilipin+ cells (red) are adjacent to CD45+ immune cells (green), ER-TR7+ activated fibroblasts (green) and GS-IB4+ blood vessels (green). After 7 days, fibroblasts have populated the wound bed with perilipin+ adipocytes. Arrows indicate perilipin+ adipocytes at day 5. Asterisk indicates background staining. Scale bars: 200 μm in A (top); 100 μm in A (middle), C and D; 25 μm in A (bottom) and C (inset).
Fig. 2.
Fig. 2.
Adipocyte progenitors proliferate during skin wound healing. (A) FACS analysis of adipocyte progenitors in non-wounded and wounded skin tissue at 5 and 7 days after wounding. Biexponential x and y axes are shown for the Lin- populations. Percentages of Lin-, CD24+, CD34+ and CD29+ (adipocyte progenitor cells) cell populations are shown in each plot. (B) The percentage of Lin-, CD24+, CD34+ and CD29+ (adipocyte progenitor cells) is quantified at each time point. n=6 wounds from three mice for all time points. (C) The percentage of proliferative (BrdU+) adipocyte progenitor cells increases during wound healing. n=6 wounds from three mice for all time points. Error bars indicate s.e.m. NW, non-wounded control.
Fig. 3.
Fig. 3.
AZIP skin wounds show dermal wound healing defects but normal re-epithelialization and macrophage recruitment. (A) The percentage of re-epithelialization is impaired in wounds of ob/ob mice at 5 days but not in wounds of AZIP mice as compared with wounds of littermate controls. *P=0.03. n=2-4 wounds per mouse from three to five mice. (B) Wound contraction is determined by measuring the distance between the edges of the panniculus carnosus. There is no significant difference in AZIP mouse wounds compared with WT. n>6 wounds from four mice. (C) Proliferation of keratinocytes was measured by incorporation of BrdU after a 24-hour pulse. The number of BrdU+ keratinocytes is similar in littermate control and AZIP wounds at 3 and 5 days. n=4 per mouse for three to five mice. (D) AZIP wounds show F4/80+ macrophage populations similar to controls at 5 days after wounding. Dotted line indicates the epidermal-dermal boundary. (E) H&E-stained and immunostained sections of wounds from AZIP, ob/ob and FVB control mice 7 (AZIP, FVB) or 5 (ob/ob) days after wounding. The AZIP dermal compartment is noticeably disorganized compared with that of controls (black dotted line). Skin wounds of AZIP mice show a lack of ER-TR7+ or α-SMA+ dermal fibroblasts, whereas ob/ob mice display normal fibroblast presence. Trichrome staining (bottom row) shows a lack of collagen in the wound bed of AZIP mice compared with controls and ob/ob wounds, but normal collagen localization in non-wounded dermis (insets). White dotted line indicates epidermal-dermal boundary. (F) Corrected total fluorescence (CTF) of immunostaining with ER-TR7 and α-SMA antibodies in wound beds of 7-day wounds from mice of the indicated genotype. For each image, CTF was calculated by determining the integrated density of wound bed fluorescence or adjacent non-wounded area (NW) and subtracting the area multiplied by the mean background fluorescence of the epidermis. **P=0.009, ER-TR7; **P=0.005, α-SMA. n=8 wounds from four mice. Error bars indicate s.e.m. Scale bars: 100 μm, except 200 μm in E (top).
Fig. 4.
Fig. 4.
Pharmacological inhibition of adipogenesis abrogates fibroblast presence in skin wounds. (A) ER-TR7+ fibroblasts and α-SMA+ myofibroblasts are absent in GW9662-injected and BADGE-injected wound beds compared with vehicle-injected controls at 7 days after wounding, but are present along wound edges (WE, solid line). Dotted line indicates epidermal-dermal boundary. (B) Corrected total fluorescence (CTF) of immunostaining with ER-TR7 and α-SMA antibodies in wound bed or non-wounded (NW) dermal regions of 5-day wounds of mice of the indicated genotype. n=10 wounds from five mice. **P=0.004, ER-TR7; *P=0.016, α-SMA. Veh, vehicle-treated control. (C) Dot plots with biexponential x-axes showing FACS staining and gating of CD45-/α-SMA+ myofibroblasts (black boxes) from non-wounded or wounded vehicle- and GW9662-injected mice at 5 and 7 days after wounding. Percentages of myofibroblasts are indicated in each plot. Beneath is shown the quantification of the CD45+/α-SMA+ fibrocytes and CD45-/α-SMA+ myofibroblasts in non-wounded, 5-day or 7-day wounds. **P=0.007. n=6 mice for each time point from two experiments. (D) Western analysis confirms the decrease in α-SMA production in GW9662-injected mouse skin compared with the wounds of vehicle-injected controls at 5 days after wounding. (E) The experimental design to treat mice with GW9662 during different time points following wounding. Mice were treated with GW9662 from days 0-2, 3-5 or 0-7 and analyzed at day 7. Beneath is shown immunostaining with antibodies against perilipin, demonstrating reduced adipocyte formation with GW9662 treatment from days 3-5 or 0-7. Fibroblasts (ER-TR7+ cells) are recruited into the wound bed when mice are treated with GW9662 from days 0-2 but impaired at other time points. Dotted line indicates epidermal-dermal boundary. Asterisk indicates background staining in epidermis. Error bars indicate s.e.m. Scale bars: 100 μm.
Fig. 5.
Fig. 5.
PPARγ inhibitors influence fibroblast function during wound healing. (A) Collagen production is reduced in GW9662-injected wounds compared with vehicle controls as seen by trichrome staining. Arrowheads indicate collagen production. To the right is shown the quantitation of collagen foci in vehicle- and GW9662-injected mice at 7 days after wounding. *P=0.0125. n=4-5 wounds from four mice. (B) mRNA analysis via real-time PCR of collagen Iα1, collagen IIIα1 and fibronectin in wounds of mice injected with GW9662 indicates reduced expression of these genes compared with wounds of vehicle-injected mice at the same time point after wounding. *P>0.02, **P=0.003, ***P=0.0001. n=6-8 wounds from two experiments for each time point. (C) Western analysis confirms the lack of fibronectin (FN) protein production in wounds of GW9662-injected mice compared with wounds of vehicle-injected mice 5 days after wounding. Error bars indicate s.e.m. Scale bars: 200 μm.
Fig. 6.
Fig. 6.
Wound recurrence after 2 weeks of healing in AZIP and GW9662-treated mice. (A) H&E-stained sections illustrate the development of epidermal defects and a lack of dermal healing in AZIP and GW9662-injected mice 2 weeks after wounding. Dotted line indicates epidermal-dermal boundary. Asterisk indicates new scab over wound. (B,C) Wound bed area and wound contraction are significantly increased in AZIP and GW9662-injected (GW) mice compared with controls. *P=0.02, **P=0.002-0.003, ***P=0.0004-0.0008. n=3-4 wounds from four mice for each condition. Dotted lines indicate mean values at 1 week (wk). (D) Epidermal area is increased in AZIP and GW9662-injected wounds after 2 weeks. **P=0.002-0.005, ***P=0.0008 n=3-4 wounds from three mice for each condition. (E) KI67 immunostaining of skin sections of control, AZIP and GW9662-injected mice 2 weeks after wounding. (F) Quantification of KI67+ cells in the epidermis of control, GW9662-injected and AZIP mice 2 weeks after wounding. **P=0.004-0.006. n=3 wounds from three mice for each condition. Error bars indicate s.e.m. Scale bars: 200 μm in A; 50 μm in E.
Fig. 7.
Fig. 7.
Adipocytes influence fibroblast migration and not proliferation. (A) Skin sections immunostained with ER-TR7 antibodies illustrate the location of fibroblasts at the wound edge (WE, solid line) in AZIP and GW9662-treated mice and in the wound bed (WB) in control mice at the indicated days after wounding. Dotted line represents epidermal-dermal boundary. (B) The number of ER-TR7+ fibroblasts in the entire wound was quantified in high-magnification images of immunostained skin sections from control (CTL), AZIP, vehicle- and GW9662-treated mice at the indicated days after wounding. **P=0.005-0.008, ***P=0.0001-0.0002. n=3 wounds from three mice for each genotype or condition. (C) Analysis of fibroblast proliferation by immunostaining with antibodies against vimentin (green) and BrdU (red). Arrowheads indicate proliferating fibroblasts. To the right is shown the quantification of vimentin+, BrdU+ fibroblasts at the wound edge in vehicle- and GW9662-injected mice, demonstrating no difference in proliferative cell number. n=7 wounds from three mice for each condition. (D) Analysis of fibroblast proliferation and migration from skin explants in dermal cell- or adipocyte (Adipo)-conditioned medium (CM). Fibroblasts in dermal cell- or adipocyte cell-conditioned medium were analyzed for BrdU incorporation during a 6-hour pulse. Phase-contrast images are shown of skin explants (black, bottom), illustrating the difference in migration distance. Fibroblast outgrowth is enhanced in skin explants in adipocyte-conditioned medium compared with dermal cell-conditioned medium. *P=0.04-0.01. n=3 explants in two independent experiments. Error bars indicate s.e.m. Scale bars: 100 μm.

References

    1. Arnold M., Barbul A. (2006). Nutrition and wound healing. Plast. Reconstr. Surg. 117 Suppl., 42S–58S - PubMed
    1. Bendixen A. C., Shevde N. K., Dienger K. M., Willson T. M., Funk C. D., Pike J. W. (2001). IL-4 inhibits osteoclast formation through a direct action on osteoclast precursors via peroxisome proliferator-activated receptor gamma 1. Proc. Natl. Acad. Sci. USA 98, 2443–2448 - PMC - PubMed
    1. Biernaskie J., Paris M., Morozova O., Fagan B. M., Marra M., Pevny L., Miller F. D. (2009). SKPs derive from hair follicle precursors and exhibit properties of adult dermal stem cells. Cell Stem Cell 5, 610–623 - PMC - PubMed
    1. Blanpain C., Lowry W. E., Geoghegan A., Polak L., Fuchs E. (2004). Self-renewal, multipotency, and the existence of two cell populations within an epithelial stem cell niche. Cell 118, 635–648 - PubMed
    1. Brack A. S., Conboy M. J., Roy S., Lee M., Kuo C. J., Keller C., Rando T. A. (2007). Increased Wnt signaling during aging alters muscle stem cell fate and increases fibrosis. Science 317, 807–810 - PubMed

Publication types