. 2013 May;23(5):777-88.
doi: 10.1101/gr.152140.112. Epub 2013 Mar 12.

Patterns of regulatory activity across diverse human cell types predict tissue identity, transcription factor binding, and long-range interactions

Affiliations

Patterns of regulatory activity across diverse human cell types predict tissue identity, transcription factor binding, and long-range interactions

Nathan C Sheffield et al. Genome Res. 2013 May.

Abstract

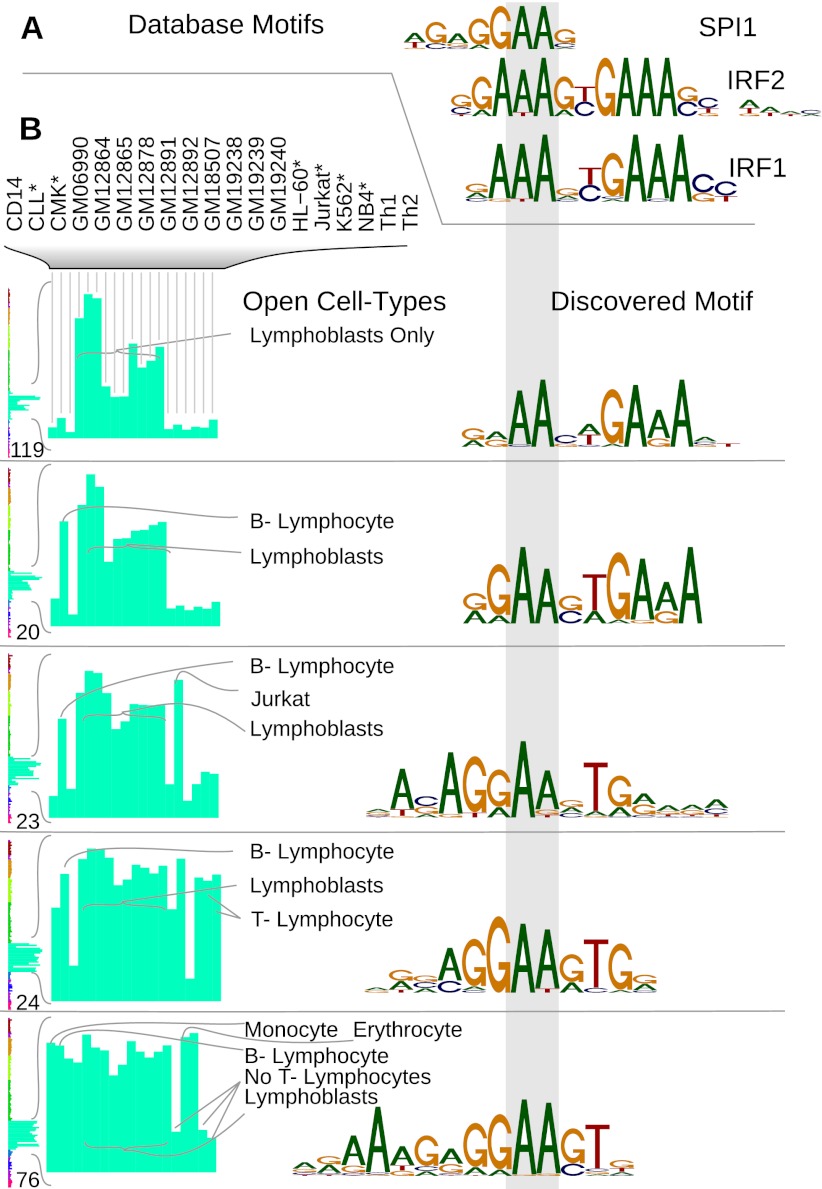
Regulatory elements recruit transcription factors that modulate gene expression distinctly across cell types, but the relationships among these remains elusive. To address this, we analyzed matched DNase-seq and gene expression data for 112 human samples representing 72 cell types. We first defined more than 1800 clusters of DNase I hypersensitive sites (DHSs) with similar tissue specificity of DNase-seq signal patterns. We then used these to uncover distinct associations between DHSs and promoters, CpG islands, conserved elements, and transcription factor motif enrichment. Motif analysis within clusters identified known and novel motifs in cell-type-specific and ubiquitous regulatory elements and supports a role for AP-1 regulating open chromatin. We developed a classifier that accurately predicts cell-type lineage based on only 43 DHSs and evaluated the tissue of origin for cancer cell types. A similar classifier identified three sex-specific loci on the X chromosome, including the XIST lincRNA locus. By correlating DNase I signal and gene expression, we predicted regulated genes for more than 500K DHSs. Finally, we introduce a web resource to enable researchers to use these results to explore these regulatory patterns and better understand how expression is modulated within and across human cell types.


Figures

Figure 1.
Figure 1.
SOM clustering of DHS profiles. (A) A 50 × 50 self-organizing map (SOM). Each box represents a cluster of DHSs with similar DNase-seq signal profiles across samples, color-coded by tissue (legend, left). Cluster color corresponds to the combination of cell types in which the associated DHSs have high signal in the detailed profile. Square size indicates the number of DHSs assigned. (B) Average DHS profiles across samples for four individual clusters. Clusters contain sites open in highly related cell types (54 and 25) and less related cell types (1091 and 1295). (*) Malignant samples.
Figure 2.
Figure 2.
Distribution of conservation, promoters, and CpG islands across clusters. (A) Each cluster is plotted as a bubble. The x-axis indicates the percent of the top 100 DHSs in that cluster (ranked by nearness to the cluster center) that overlap a CpG island; the y-axis indicates the percent that overlap a promoter; color indicates the percent that overlap a phastCons conserved element (Siepel et al. 2005). The size of the bubble indicates the number of DHSs belonging to the cluster. (Red bubbles in the upper-right corner) Clusters capturing primarily highly conserved, CpG-rich promoter elements. (B) DNase I signal profiles of five example clusters, showing the distribution of distance to the transcription start site (TSS) of the nearest gene. Cluster 99 is promoter rich; cluster 1259 is preferentially located in an early intron; cluster 199 is highly conserved, but not associated with promoters or CpG islands; cluster 881 is primarily distal, with no regions within 500 bp of a TSS (see also Supplemental Fig. S2).
Figure 3.
Figure 3.
Tissue and sex classifiers based on DNase I data. Predictions from a multinomial logistic regression classifier trained to predict tissue identity for a given sample with data from 43 DHSs. (A) Predictions for training data, along with known tissue of origin (left column). Colors within the heatmaps reflect the predicted probability of belonging to each of the seven tissue classes. (B) Predictions for malignant samples not included in the training, but whose presumed tissue of origin was included in the model. (*) Malignant samples. (C) Predictions for samples whose tissue (or presumed tissue) was excluded from the training because tissue types had fewer than five samples. (D) The DNase I signal profiles of seven (out of 43) clusters selected by the model with positive coefficients. (E) The DNase I profile for the single sex-specific site (chrX:130926460–130926610) selected by the classifier. The enlarged barplot shows the distinction between samples divided by sex for the subset of samples included in the model.
Figure 4.
Figure 4.
De novo motif discovery results. (A) Representative examples of de novo motif discovery results and highly significant known motif matches. (B,C) De novo motif discovery identified several enriched motifs for which there were no convincing matches to the TF databases. We sometimes found a similar motif across multiple clusters associated with similar cell types.
Figure 5.
Figure 5.
Variations in IRF-like motifs in hematopoietic clusters. (A) Motifs for IRFs and SPI1 from JASPAR show both common and distinct features. (B) MEME motifs discovered in several hematopoietic-specific clusters. The clusters vary in cell-type specificity among the hematopoietic cell types, and the motif logo varies as well, while retaining some semblance of the known SPI1/IRF family motifs.
Figure 6.
Figure 6.
Motif specificity in SOM clusters. (A) Concordance ([yellow] high, [blue] low) between ChIP results (x-axis) and motif discovery in DNase I clusters (y-axis). (B) The cell-type specificity for selected motifs. This heatmap shows the distribution of most-open tissues for each motif. For example, 100% of the clusters where the POU5F1 motif was found had stem cells (Stem) as the most open tissue type, whereas MYF family motifs were found predominantly in muscle clusters. (C,D) Each colored square represents a cluster with enrichment for the given motif. (x-axis) overlap with CpG islands; (y-axis) overlap with promoters; (color) the number of tissues with at least one sample above a cutoff. Each factor shown here has a different distribution of cell-type specificity and promoter/CpG-island overlap. The size of a square indicates the number of DHSs in the cluster. (E) Number of clusters that are enriched for the most common motifs.
Figure 7.
Figure 7.
Correlation between DHS and expression. (A) Tie-plot showing the top 50 connections at the beta-globin locus, color coded by tissue type. Red marks below indicate DHSs. Blue bars above represent genes. Connecting lines represent significant correlations, where the width of the lines is proportional to the correlation strength. To simplify the illustration, connections to the olfactory receptors have been removed (see Supplemental Material). (B) Tie-plot for the H19/IGF2 locus (see also Supplemental Fig. S4D).

References

    1. Akalin A, Fredman D, Arner E, Dong X, Bryne JC, Suzuki H, Daub CO, Hayashizaki Y, Lenhard B 2009. Transcriptional features of genomic regulatory blocks. Genome Biol 10: R38. - PMC - PubMed
    1. Angel P, Hess J 2012. The multi-gene family of transcription factor AP-1. In Regulation of organelle and cell compartment signaling: Cell signaling collection (ed. Bradshaw RA, Dennis EA), pp. 53–62. Academic Press, San Diego
    1. Angel P, Karin M 1991. The role of Jun, Fos and the AP-1 complex in cell-proliferation and transformation. Biochim Biophys Acta 1072: 129–157 - PubMed
    1. Bailey TL, Elkan C 1994. Fitting a mixture model by expectation maximization to discover motifs in biopolymers. Proc Int Conf Intell Syst Mol Biol 2: 28–36 - PubMed
    1. Biddie SC, John S, Sabo PJ, Thurman RE, Johnson TA, Schiltz RL, Miranda TB, Sung M-H, Trump S, Lightman SL, et al. 2011. Transcription factor AP1 potentiates chromatin accessibility and glucocorticoid receptor binding. Mol Cell 43: 145–155 - PMC - PubMed

Publication types