

Biodiversity effects on plant stoichiometry
- PMID: 23483990
- PMCID: PMC3587429
- DOI: 10.1371/journal.pone.0058179
Biodiversity effects on plant stoichiometry
Abstract
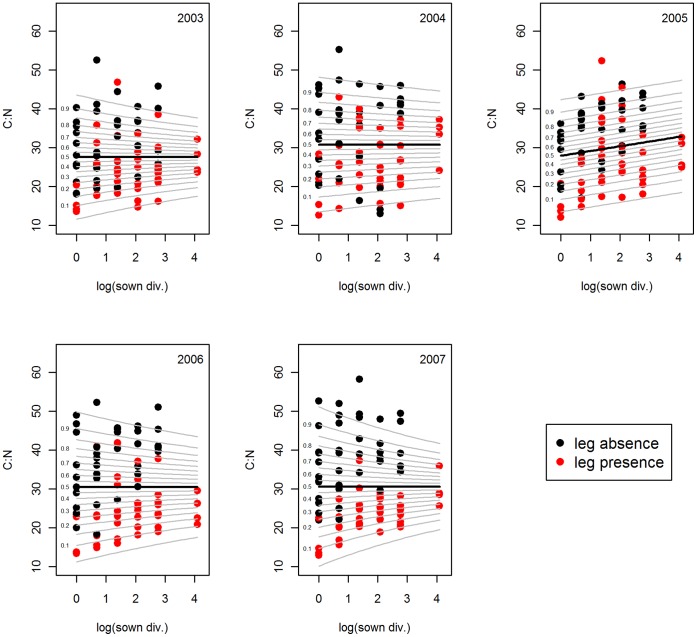
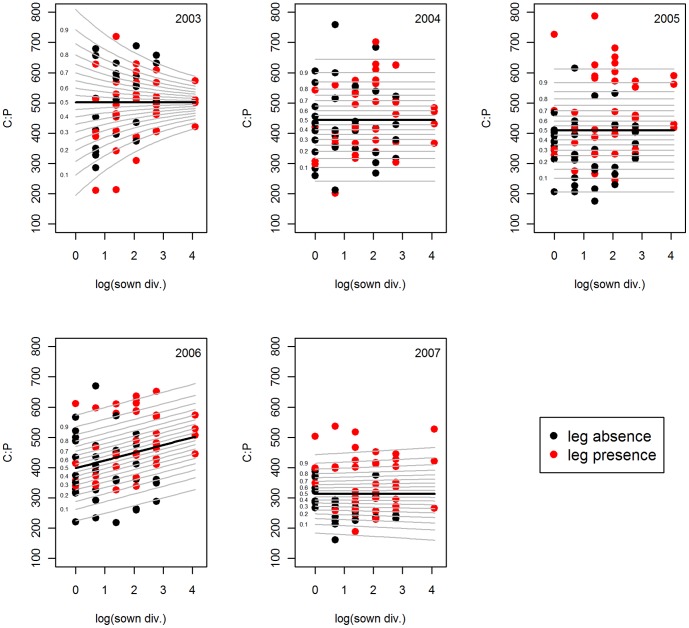
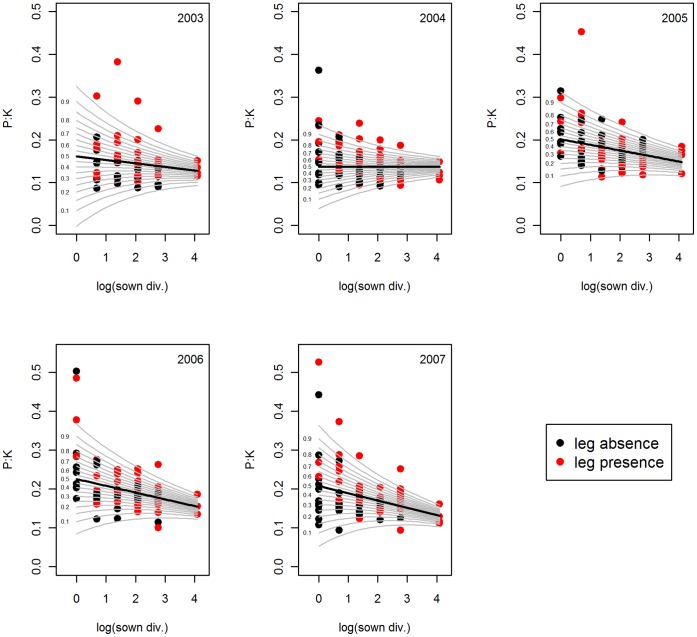
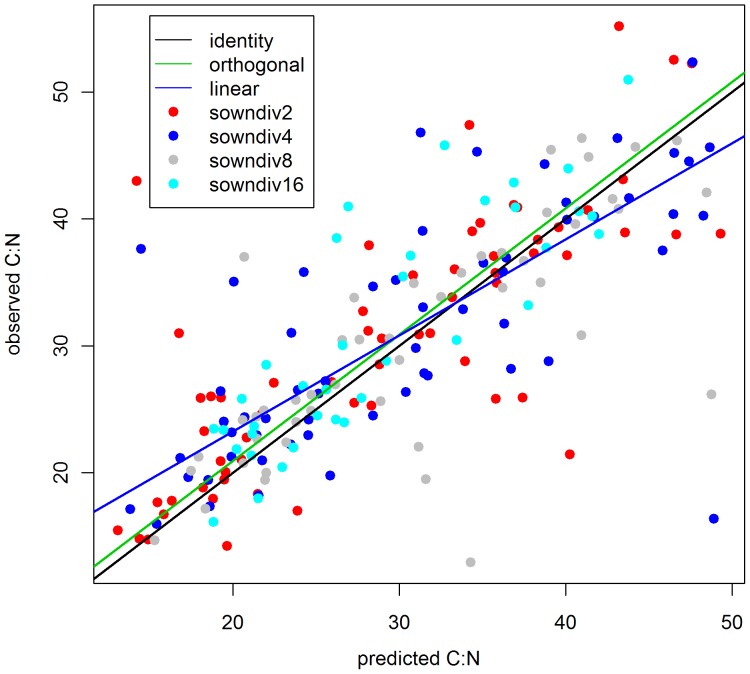
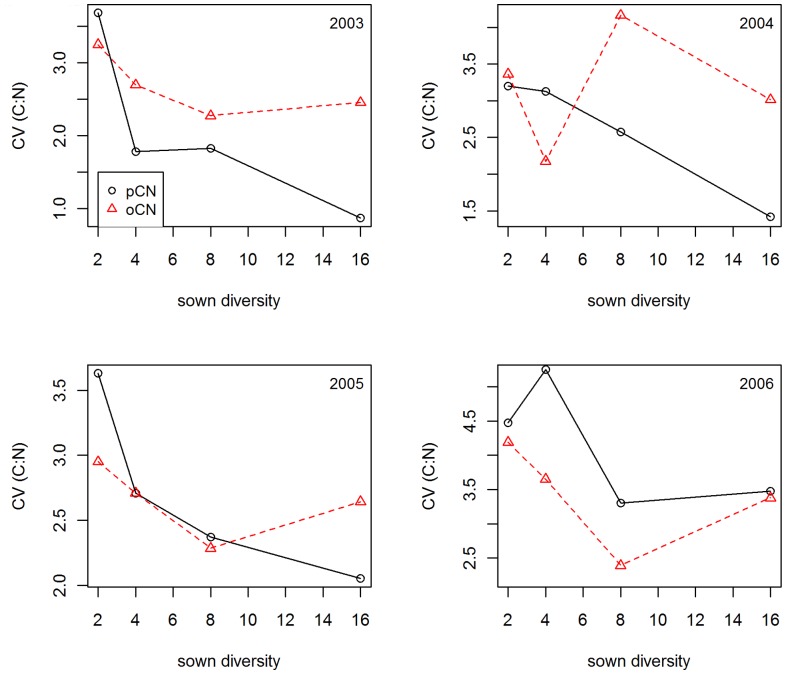
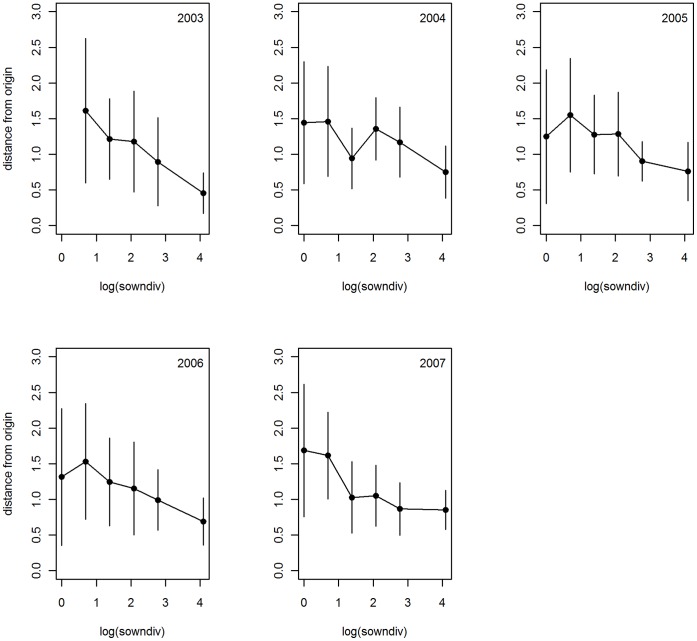
In the course of the biodiversity-ecosystem functioning debate, the issue of multifunctionality of species communities has recently become a major focus. Elemental stoichiometry is related to a variety of processes reflecting multiple plant responses to the biotic and abiotic environment. It can thus be expected that the diversity of a plant assemblage alters community level plant tissue chemistry. We explored elemental stoichiometry in aboveground plant tissue (ratios of carbon, nitrogen, phosphorus, and potassium) and its relationship to plant diversity in a 5-year study in a large grassland biodiversity experiment (Jena Experiment). Species richness and functional group richness affected community stoichiometry, especially by increasing C:P and N:P ratios. The primacy of either species or functional group richness effects depended on the sequence of testing these terms, indicating that both aspects of richness were congruent and complementary to expected strong effects of legume presence and grass presence on plant chemical composition. Legumes and grasses had antagonistic effects on C:N (-27.7% in the presence of legumes, +32.7% in the presence of grasses). In addition to diversity effects on mean ratios, higher species richness consistently decreased the variance of chemical composition for all elemental ratios. The diversity effects on plant stoichiometry has several non-exclusive explanations: The reduction in variance can reflect a statistical averaging effect of species with different chemical composition or a optimization of nutrient uptake at high diversity, leading to converging ratios at high diversity. The shifts in mean ratios potentially reflect higher allocation to stem tissue as plants grew taller at higher richness. By showing a first link between plant diversity and stoichiometry in a multiyear experiment, our results indicate that losing plant species from grassland ecosystems will lead to less reliable chemical composition of forage for herbivorous consumers and belowground litter input.
Conflict of interest statement
Figures
References
-
- Balvanera P, Pfisterer AB, Buchmann N, He J-S, Nakashizuka T, et al.. (2006) Quantifying the evidence for biodiversity effects on ecosystem functioning and services. Ecology letters 9: 1146–1156. Available: http://www.ncbi.nlm.nih.gov/pubmed/16972878. Accessed 5 July 2011. - PubMed
-
- Cardinale BJ, Srivastava DS, Duffy JE, Wright JP, Downing AL, et al.. (2006) Effects of biodiversity on the functioning of trophic groups and ecosystems. Nature 443: 989–992. Available: http://www.ncbi.nlm.nih.gov/pubmed/17066035. Accessed 6 July 2011. - PubMed
-
- Hooper DU, Chapin FS, Ewel JJ, Hector A, Inchausti P, et al. (2005) Effects of Biodiversity on Ecosystem Functioning: A consensus of current knowledge. Ecological Monographs 75: 3–35.
-
- Hillebrand H, Matthiessen B (2009) Biodiversity in a complex world: consolidation and progress in functional biodiversity research. Ecology letters 12: 1405–1419. Available: http://www.ncbi.nlm.nih.gov/pubmed/19849711. Accessed 5 July 2011. - PubMed
-
- Gamfeldt L, Hillebrand H, Jonsson PR (2008) Multiple functions increase the importance of biodiversity for overall ecosystem functioning. Ecology 89: 1223–1231. - PubMed
Publication types
MeSH terms
Substances
LinkOut - more resources
Full Text Sources
Other Literature Sources
