

Hemodynamic flow improves rat hepatocyte morphology, function, and metabolic activity in vitro
- PMID: 23485712
- PMCID: PMC3677175
- DOI: 10.1152/ajpcell.00331.2012
Hemodynamic flow improves rat hepatocyte morphology, function, and metabolic activity in vitro
Abstract
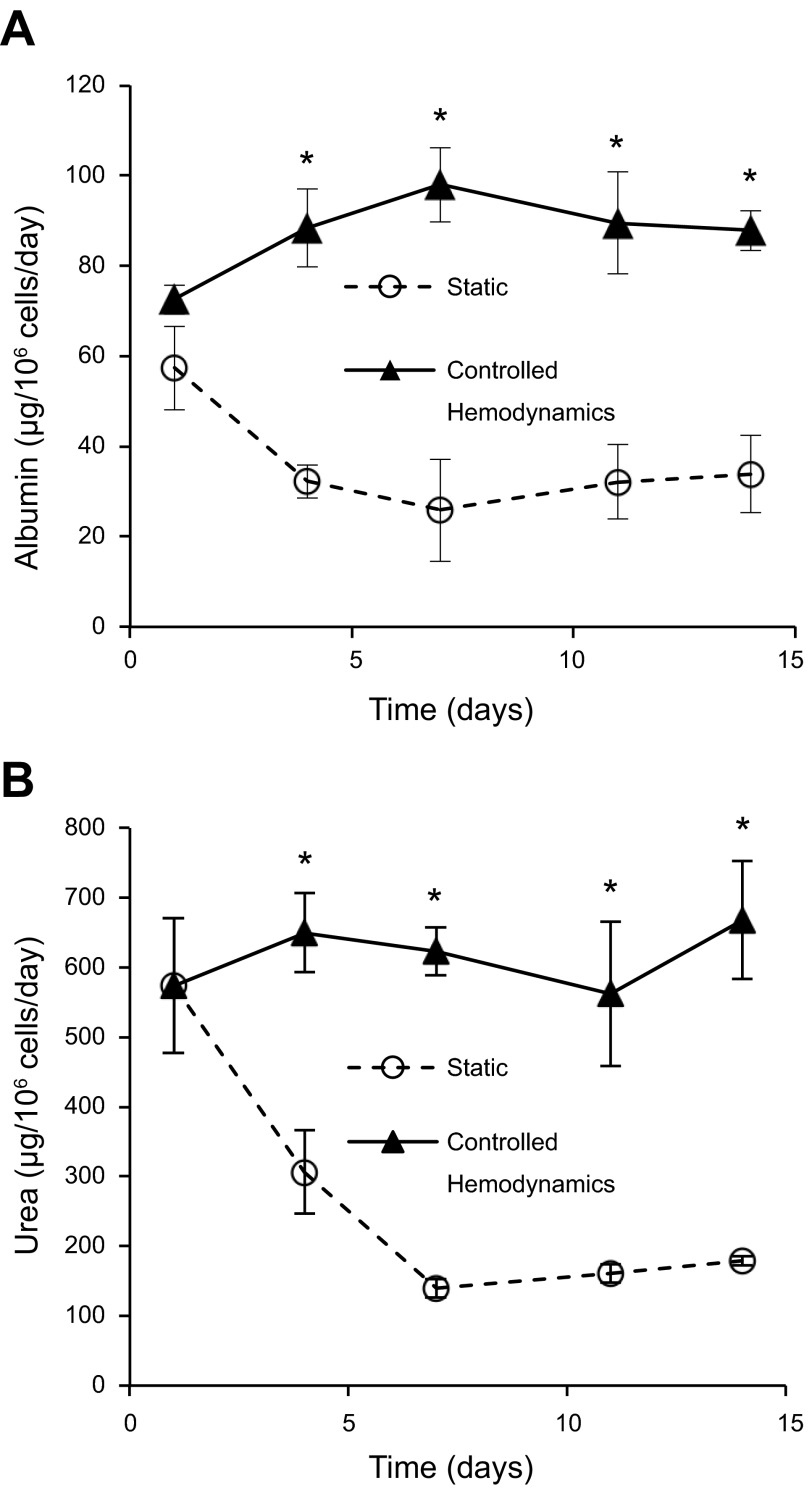
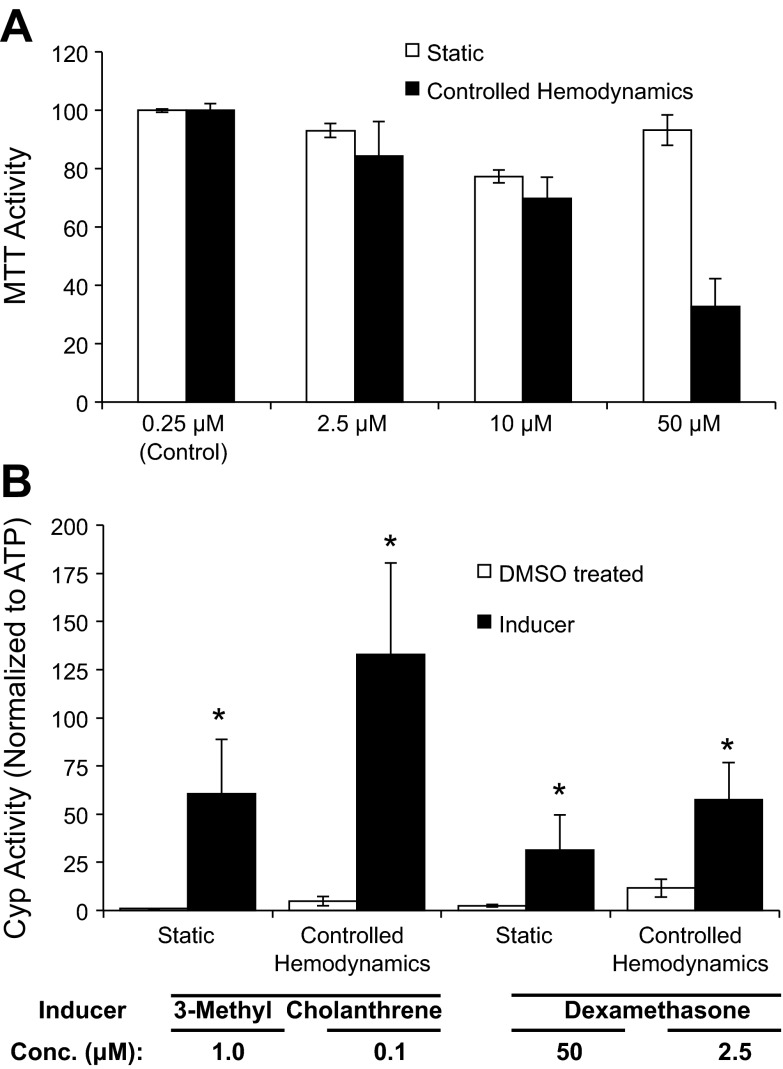
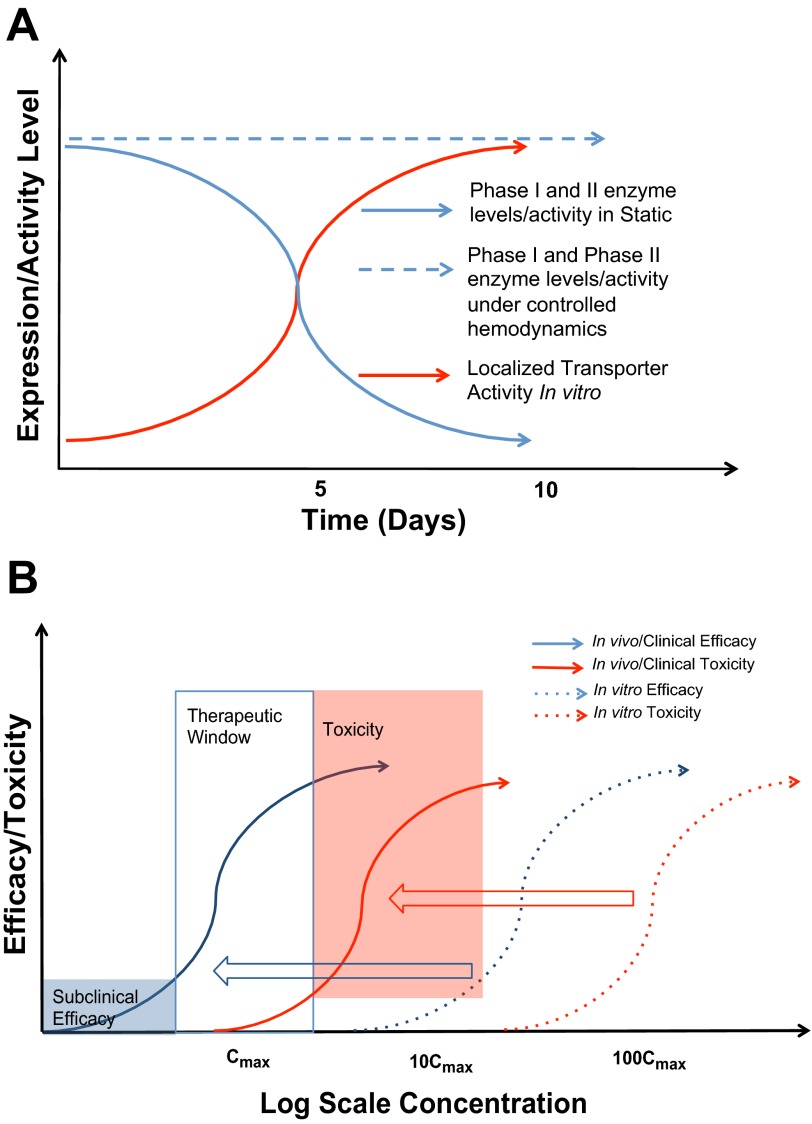
In vitro primary hepatocyte systems typically elicit drug induction and toxicity responses at concentrations much higher than corresponding in vivo or clinical plasma C(max) levels, contributing to poor in vitro-in vivo correlations. This may be partly due to the absence of physiological parameters that maintain metabolic phenotype in vivo. We hypothesized that restoring hemodynamics and media transport would improve hepatocyte architecture and metabolic function in vitro compared with nonflow cultures. Rat hepatocytes were cultured for 2 wk either in nonflow collagen gel sandwiches with 48-h media changes or under controlled hemodynamics mimicking sinusoidal circulation within a perfused Transwell device. Phenotypic, functional, and metabolic parameters were assessed at multiple times. Hepatocytes in the devices exhibited polarized morphology, retention of differentiation markers [E-cadherin and hepatocyte nuclear factor-4α (HNF-4α)], the canalicular transporter [multidrug-resistant protein-2 (Mrp-2)], and significantly higher levels of liver function compared with nonflow cultures over 2 wk (albumin ~4-fold and urea ~5-fold). Gene expression of cytochrome P450 (CYP) enzymes was significantly higher (fold increase over nonflow: CYP1A1: 53.5 ± 10.3; CYP1A2: 64.0 ± 15.1; CYP2B1: 15.2 ± 2.9; CYP2B2: 2.7 ± 0.8; CYP3A2: 4.0 ± 1.4) and translated to significantly higher basal enzyme activity (device vs. nonflow: CYP1A: 6.26 ± 2.41 vs. 0.42 ± 0.015; CYP1B: 3.47 ± 1.66 vs. 0.4 ± 0.09; CYP3A: 11.65 ± 4.70 vs. 2.43 ± 0.56) while retaining inducibility by 3-methylcholanthrene and dexamethasone (fold increase over DMSO: CYP1A = 27.33 and CYP3A = 4.94). These responses were observed at concentrations closer to plasma levels documented in vivo in rats. The retention of in vivo-like hepatocyte phenotype and metabolic function coupled with drug response at more physiological concentrations emphasizes the importance of restoring in vivo physiological transport parameters in vitro.
Keywords: hemodynamics; hepatocyte; metabolism; organotype; phenotype.
Figures


Similar articles
-
Studies on the induction of rat hepatic CYP1A, CYP2B, CYP3A and CYP4A subfamily form mRNAs in vivo and in vitro using precision-cut rat liver slices.Xenobiotica. 2003 May;33(5):511-27. doi: 10.1080/0049825031000085960. Xenobiotica. 2003. PMID: 12746107
-
Regulation of the major detoxication functions by phenobarbital and 3-methylcholanthrene in co-cultures of rat hepatocytes and liver epithelial cells.Eur J Biochem. 1997 Feb 15;244(1):98-106. doi: 10.1111/j.1432-1033.1997.00098.x. Eur J Biochem. 1997. PMID: 9063451
-
Collagen type I gel cultures of adult rat hepatocytes as a screening induction model for cytochrome P450-dependent enzymes.Altern Lab Anim. 2001 Mar-Apr;29(2):179-92. doi: 10.1177/026119290102900202. Altern Lab Anim. 2001. PMID: 11262762
-
Preclinical evaluation of drug-drug interaction potential: present status of the application of primary human hepatocytes in the evaluation of cytochrome P450 induction.Chem Biol Interact. 1997 Nov 6;107(1-2):5-16. doi: 10.1016/s0009-2797(97)00070-7. Chem Biol Interact. 1997. PMID: 9402946 Review.
-
Hepatocyte cultures: From collagen gel sandwiches to microfluidic devices with integrated biosensors.APL Bioeng. 2021 Oct 14;5(4):041504. doi: 10.1063/5.0058798. eCollection 2021 Dec. APL Bioeng. 2021. PMID: 34703968 Free PMC article. Review.
Cited by
-
Multi-cellular 3D human primary liver cell culture elevates metabolic activity under fluidic flow.Lab Chip. 2015 May 21;15(10):2269-77. doi: 10.1039/c5lc00237k. Lab Chip. 2015. PMID: 25857666 Free PMC article.
-
Cell spinpods are a simple inexpensive suspension culture device to deliver fluid shear stress to renal proximal tubular cells.Sci Rep. 2021 Oct 29;11(1):21296. doi: 10.1038/s41598-021-00304-8. Sci Rep. 2021. PMID: 34716334 Free PMC article.
-
The evolution of strategies to minimise the risk of human drug-induced liver injury (DILI) in drug discovery and development.Arch Toxicol. 2020 Aug;94(8):2559-2585. doi: 10.1007/s00204-020-02763-w. Epub 2020 May 6. Arch Toxicol. 2020. PMID: 32372214 Free PMC article. Review.
-
Biochemical and anaplerotic applications of in vitro models of propionic acidemia and methylmalonic acidemia using patient-derived primary hepatocytes.Mol Genet Metab. 2020 Jul;130(3):183-196. doi: 10.1016/j.ymgme.2020.05.003. Epub 2020 May 11. Mol Genet Metab. 2020. PMID: 32451238 Free PMC article.
-
Assembly of Hepatocyte Spheroids Using Magnetic 3D Cell Culture for CYP450 Inhibition/Induction.Int J Mol Sci. 2017 May 18;18(5):1085. doi: 10.3390/ijms18051085. Int J Mol Sci. 2017. PMID: 28524079 Free PMC article.
References
-
- Baker TK, Carfagna MA, Gao H, Dow ER, Li Q, Searfoss GH, Ryan TP. Temporal gene expression analysis of monolayer cultured rat hepatocytes. Chem Res Toxicol 14: 1218–1231, 2001 - PubMed
-
- Beigel J, Fella K, Kramer PJ, Kroeger M, Hewitt P. Genomics and proteomics analysis of cultured primary rat hepatocytes. Toxicol In Vitro 22: 171–181, 2008 - PubMed
-
- Bhatia SN, Yarmush ML, Toner M. Controlling cell interactions by micropatterning in cocultures: hepatocytes and 3T3 fibroblasts. J Biomed Mater Res 34: 189–199, 1997 - PubMed
-
- Boess F, Kamber M, Romer S, Gasser R, Muller D, Albertini S, Suter L. Gene expression in two hepatic cell lines, cultured primary hepatocytes, and liver slices compared with the in vivo liver gene expression in rats: possible implications for toxicogenomics use of in vitro systems. Toxicol Sci 73: 386–402, 2003 - PubMed
Publication types
MeSH terms
Substances
Grants and funding
LinkOut - more resources
Full Text Sources
Other Literature Sources