. 2013 Mar 21;495(7441):375-8.
doi: 10.1038/nature11940. Epub 2013 Mar 13.

Multiple phases of chondrocyte enlargement underlie differences in skeletal proportions

Affiliations

Multiple phases of chondrocyte enlargement underlie differences in skeletal proportions

Kimberly L Cooper et al. Nature. .

Abstract

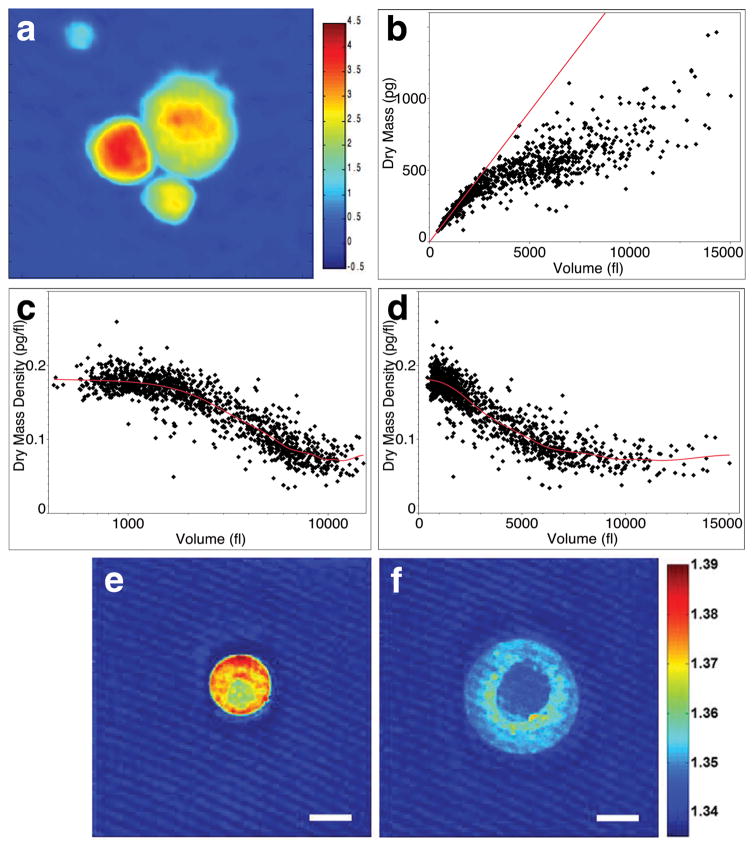
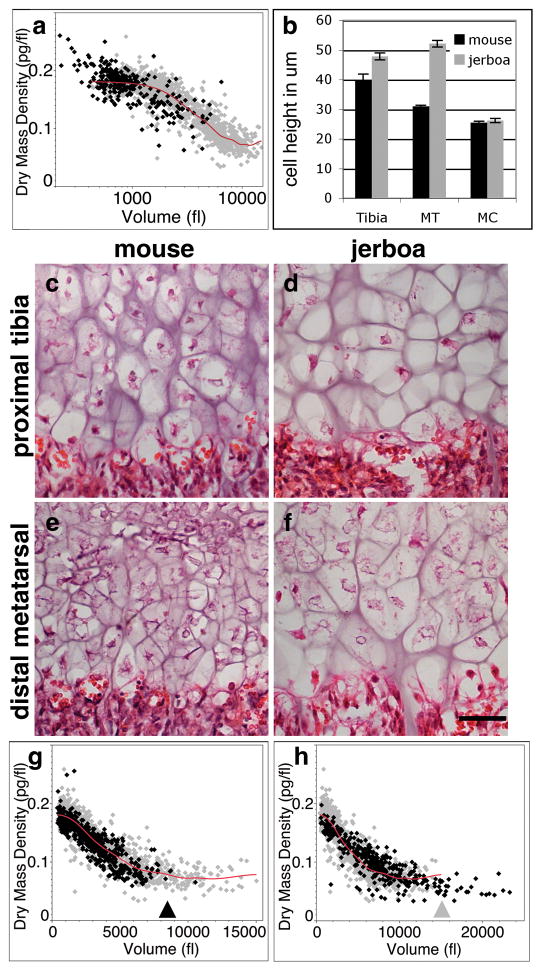
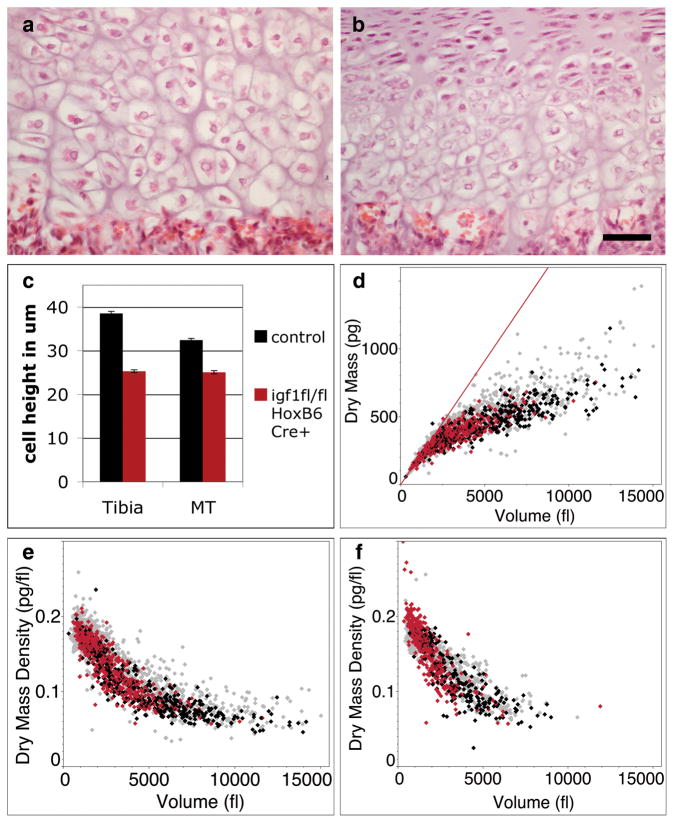
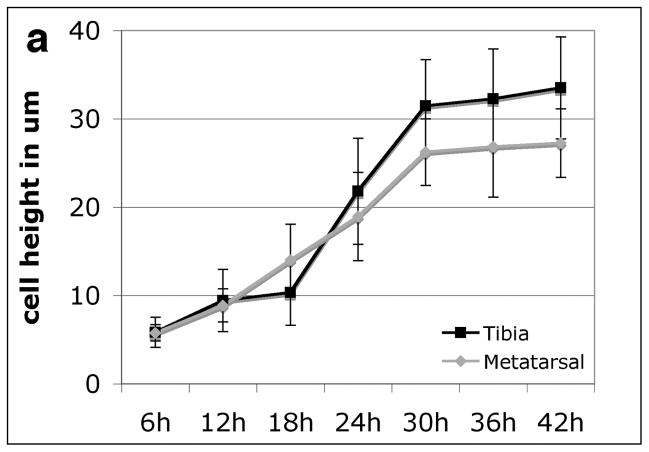
The wide diversity of skeletal proportions in mammals is evident upon a survey of any natural history museum's collections and allows us to distinguish between species even when reduced to their calcified components. Similarly, each individual is comprised of a variety of bones of differing lengths. The largest contribution to the lengthening of a skeletal element, and to the differential elongation of elements, comes from a dramatic increase in the volume of hypertrophic chondrocytes in the growth plate as they undergo terminal differentiation. However, the mechanisms of chondrocyte volume enlargement have remained a mystery. Here we use quantitative phase microscopy to show that mammalian chondrocytes undergo three distinct phases of volume increase, including a phase of massive cell swelling in which the cellular dry mass is significantly diluted. In light of the tight fluid regulatory mechanisms known to control volume in many cell types, this is a remarkable mechanism for increasing cell size and regulating growth rate. It is, however, the duration of the final phase of volume enlargement by proportional dry mass increase at low density that varies most between rapidly and slowly elongating growth plates. Moreover, we find that this third phase is locally regulated through a mechanism dependent on insulin-like growth factor. This study provides a framework for understanding how skeletal size is regulated and for exploring how cells sense, modify and establish a volume set point.


Conflict of interest statement

The authors declare no competing financial interests.

Figures

Figure 1
Figure 1. Hypertrophic chondrocytes increase in volume through three distinct phases including a phase of massive cell swelling
a, Phase image of dissociated mouse proximal tibia hypertrophic chondrocytes at postnatal day 5 (P5). Color bar represents phase shift in radians. b, Volume versus dry mass plotted for individual chondrocytes. Linear regression for cells up to 1,000 fl highlights divergence of larger cells from an initial slope of 0.183 pg/fl. Log scale (c) and linear scale (d) plots of volume versus dry mass density. Lambda for the smoothened spline in (c) and (d) is 5e+9. R2 value is 0.84. n=1249 cells summed across five independent experiments. e, f, Horizontal cross sections from regularized tomographic phase microscopy density reconstructions of a small (e) and a large (f) mouse tibia chondrocyte. Color bar represents refractive index and thus dry mass density. Scale bar is 10 μm.
Figure 2
Figure 2. Differences in cell size associated with different skeletal growth rates are attributed to modulating a common growth trajectory
a, Dissociated P5 mouse proximal radius chondrocytes (black; n=292 cells) compared to proximal tibia chondrocytes (gray in all panels; data from Fig. 1). x-axis is in log scale. b, Quantification of average maximum cell height ± s.e.m for n=3 animals of each species at P7 (>50 cells per growth plate). Two-tailed student’s t-test shows significant differences in the tibia and metatarsal growth plates between the two species (p<10−5) but not in the metacarpals (p=0.978). c–f, Histological comparison of mouse and jerboa proximal tibia and distal metatarsal hypertrophic zones at P7. Scale bar equals 50 μm. g, Dissociated P5 mouse metatarsal chondrocytes (black; n=634 cells) compared to mouse tibia chondrocytes. Black arrowhead approximates the end of the metatarsal distribution h, Jerboa metatarsal chondrocytes (black; n=366 cells) compared to mouse tibia chondrocytes. Grey arrowhead approximates the end of the mouse tibia distribution.
Figure 3
Figure 3. Igf1 is required for Phase 3 of volume enlargement by dry mass production at low dry mass density
a, b, Histology of P7 mouse proximal tibia hypertrophic zone of control (a, igf1fl/+; HoxB6-Cre+) and igf1 conditional mutant animals (b, igf1fl/fl; HoxB6-Cre+). Scalebar equals 50 μm. c, Bar plot demonstrating an average maximum cell height reduction of 34% in igf1 conditional mutant tibia and 23% in metatarsal chondrocytes compared to control litter mates. ± s.e.m. for n=3 animals of each genotype (total >80 cells per growth plate). d, Dry mass versus volume plot of dissociated P5 igf1 mutant proximal tibia hypertrophic chondrocytes. Red datapoints are igf1 mutant chondrocytes (n=569 cells), black are littermate control chondrocytes (n=373 cells), and grey represent the total wild-type data set for tibia (d, e) and metatarsal (f) (wild-type data from Fig. 1 and Fig. 2). e, f, Dry mass density versus volume plots for igf1 mutant tibia chondrocytes (n=569 cells) (e) and igf1 mutant metatarsal chondrocytes (n=412 cells) (f).
Figure 4
Figure 4. Mouse proximal tibia and distal metatarsal hypertrophic chondrocytes rapidly increase in average cell height
a, Time course of the average and standard deviation of BrdU labeled cell height indicating the rate of chondrocyte size increase after the last mitotic cycle. n>25 cells from three individuals for each time point and growth plate.

References

    1. Wilsman NJ, Farnum CE, Leiferman EM, Fry M, Barreto C. Differential growth by growth plates as a function of multiple parameters of chondrocytic kinetics. J Orthop Res. 1996;14:927–36. - PubMed
    1. Hunziker EB, Schenk RK, Cruz-Orive LM. Quantitation of chondrocyte performance in growth-plate cartilage during longitudinal bone growth. J Bone Joint Surg Am. 1987;69:162–173. - PubMed
    1. Hunziker EB, Schenk RK. Physiological mechanisms adopted by chondrocytes in regulating longitudinal bone growth in rats. J Physiol (Lond ) 1989;414:55–71. - PMC - PubMed
    1. Breur GJ, VanEnkevort BA, Farnum CE, Wilsman NJ. Linear relationship between the volume of hypertrophic chondrocytes and the rate of longitudinal bone growth in growth plates. J Orthop Res. 1991;9:348–359. - PubMed
    1. Kuhn JL, Delacey JH, Leenellett EE. Relationship between bone growth rate and hypertrophic chondrocyte volume in new zealand white rabbits of varying ages. Journal of Orthopaedic Research. 1996;14:706–711. - PubMed

Publication types

Substances