

Molecular mechanisms creating bistable switches at cell cycle transitions
- PMID: 23486222
- PMCID: PMC3718337
- DOI: 10.1098/rsob.120179
Molecular mechanisms creating bistable switches at cell cycle transitions
Abstract
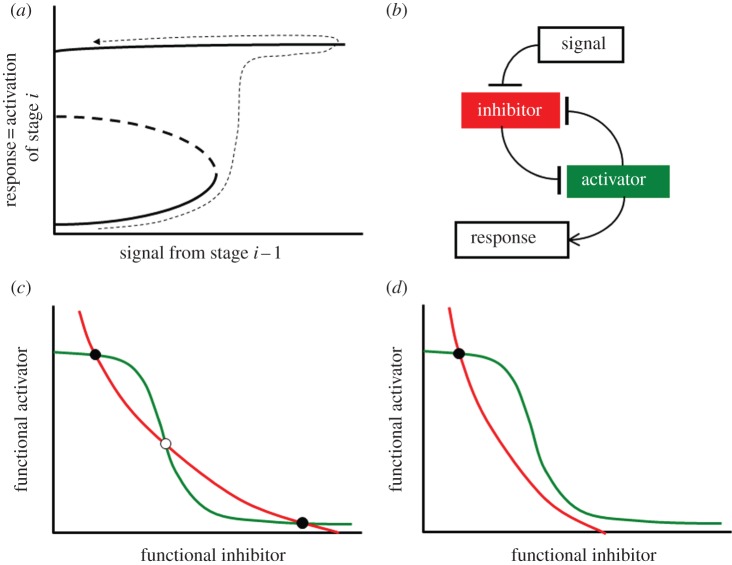
Progression through the eukaryotic cell cycle is characterized by specific transitions, where cells move irreversibly from stage i-1 of the cycle into stage i. These irreversible cell cycle transitions are regulated by underlying bistable switches, which share some common features. An inhibitory protein stalls progression, and an activatory protein promotes progression. The inhibitor and activator are locked in a double-negative feedback loop, creating a one-way toggle switch that guarantees an irreversible commitment to move forward through the cell cycle, and it opposes regression from stage i to stage i-1. In many cases, the activator is an enzyme that modifies the inhibitor in multiple steps, whereas the hypo-modified inhibitor binds strongly to the activator and resists its enzymatic activity. These interactions are the basis of a reaction motif that provides a simple and generic account of many characteristic properties of cell cycle transitions. To demonstrate this assertion, we apply the motif in detail to the G1/S transition in budding yeast and to the mitotic checkpoint in mammalian cells. Variations of the motif might support irreversible cellular decision-making in other contexts.
Figures
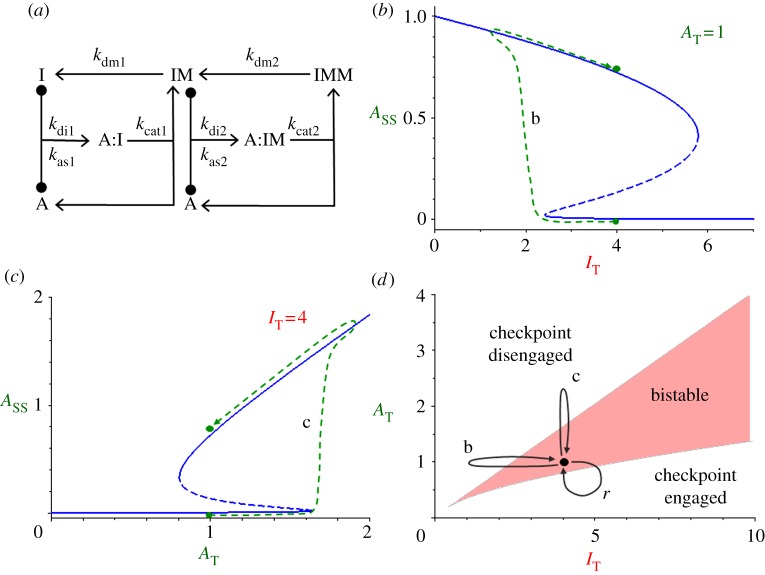
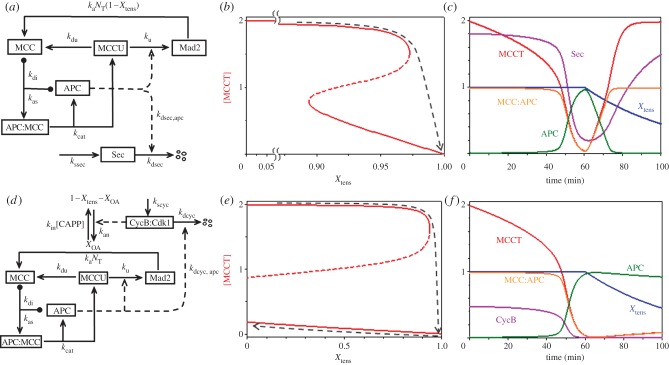
 , in the bistable zone (AT = 2 and IT = 6). There are two stable steady states—checkpoint engaged (1) and checkpoint disengaged (3)—separated by an unstable steady state (2). (d) Phase plane in the monostable zone (AT = 3 and IT = 6). There is now a single steady state: the stable checkpoint-disengaged state (3). In (c,d), the arrows indicate the direction of change of the state variables, IMM and
  , as predicted by the dynamical system, equations (3.8) and (3.9).
Similar articles
-
Cell-cycle transitions: a common role for stoichiometric inhibitors.Mol Biol Cell. 2017 Nov 7;28(23):3437-3446. doi: 10.1091/mbc.E17-06-0349. Epub 2017 Sep 20. Mol Biol Cell. 2017. PMID: 28931595 Free PMC article.
-
Cell cycle commitment in budding yeast emerges from the cooperation of multiple bistable switches.Open Biol. 2011 Nov;1(3):110009. doi: 10.1098/rsob.110009. Open Biol. 2011. PMID: 22645649 Free PMC article.
-
Redundant degrons ensure the rapid destruction of Sic1 at the G1/S transition of the budding yeast cell cycle.Cell Cycle. 2003 Sep-Oct;2(5):410-1. Cell Cycle. 2003. PMID: 12963827 No abstract available.
-
[Molecular mechanisms controlling the cell cycle: fundamental aspects and implications for oncology].Cancer Radiother. 2001 Apr;5(2):109-29. doi: 10.1016/s1278-3218(01)00087-7. Cancer Radiother. 2001. PMID: 11355576 Review. French.
-
Mechanisms of signalling-memory governing progression through the eukaryotic cell cycle.Curr Opin Cell Biol. 2021 Apr;69:7-16. doi: 10.1016/j.ceb.2020.12.003. Epub 2021 Jan 4. Curr Opin Cell Biol. 2021. PMID: 33412443 Review.
Cited by
-
Experimental testing of a new integrated model of the budding yeast Start transition.Mol Biol Cell. 2015 Nov 5;26(22):3966-84. doi: 10.1091/mbc.E15-06-0358. Epub 2015 Aug 26. Mol Biol Cell. 2015. PMID: 26310445 Free PMC article.
-
Spatiotemporal orchestration of mitosis by cyclin-dependent kinase.Nature. 2025 Jul;643(8074):1391-1399. doi: 10.1038/s41586-025-09172-y. Epub 2025 Jun 25. Nature. 2025. PMID: 40562936 Free PMC article.
-
Dissecting reversible and irreversible single cell state transitions from gene regulatory networks.bioRxiv [Preprint]. 2024 Sep 1:2024.08.30.610498. doi: 10.1101/2024.08.30.610498. bioRxiv. 2024. PMID: 39257745 Free PMC article. Preprint.
-
Detection of biological switches using the method of Gröebner bases.BMC Bioinformatics. 2019 Nov 28;20(1):615. doi: 10.1186/s12859-019-3155-0. BMC Bioinformatics. 2019. PMID: 31779580 Free PMC article.
-
Molecular signaling network motifs provide a mechanistic basis for cellular threshold responses.Environ Health Perspect. 2014 Dec;122(12):1261-70. doi: 10.1289/ehp.1408244. Epub 2014 Aug 12. Environ Health Perspect. 2014. PMID: 25117432 Free PMC article. Review.
References
-
- Nasmyth K, Hunt T. 1993. Dams and sluices. Nature 366, 634–63510.1038/366634a0 (doi:10.1038/366634a0) - DOI - DOI - PubMed
-
- Nasmyth K. 1995. Evolution of the cell cycle. Phil. Trans. R. Soc. Lond. B 349, 271–28110.1098/rstb.1995.0113 (doi:10.1098/rstb.1995.0113) - DOI - DOI - PubMed
-
- Novak B, Tyson JJ. 1993. Numerical analysis of a comprehensive model of M-phase control in Xenopus oocyte extracts and intact embryos. J. Cell Sci. 106, 1153–1168 - PubMed
-
- Tyson JJ, Novak B, Chen K, Val J. 1995. Checkpoints in the cell cycle from a modeler's perspective. Prog. Cell Cycle Res. 1, 1–810.1007/978-1-4615-1809-9_1 (doi:10.1007/978-1-4615-1809-9_1) - DOI - DOI - PubMed
-
- Novak B, Tyson JJ, Gyorffy B, Csikasz-Nagy A. 2007. Irreversible cell-cycle transitions are due to systems-level feedback. Nat. Cell Biol. 9, 724–72810.1038/ncb0707-724 (doi:10.1038/ncb0707-724) - DOI - DOI - PubMed
Publication types
MeSH terms
Substances
Grants and funding
LinkOut - more resources
Full Text Sources
Other Literature Sources
Molecular Biology Databases
