

Noninvasive characterization of the histopathologic features of pulmonary nodules of the lung adenocarcinoma spectrum using computer-aided nodule assessment and risk yield (CANARY)--a pilot study
- PMID: 23486265
- PMCID: PMC3597987
- DOI: 10.1097/JTO.0b013e3182843721
Noninvasive characterization of the histopathologic features of pulmonary nodules of the lung adenocarcinoma spectrum using computer-aided nodule assessment and risk yield (CANARY)--a pilot study
Abstract
Introduction: Pulmonary nodules of the adenocarcinoma spectrum are characterized by distinctive morphological and radiologic features and variable prognosis. Noninvasive high-resolution computed tomography-based risk stratification tools are needed to individualize their management.
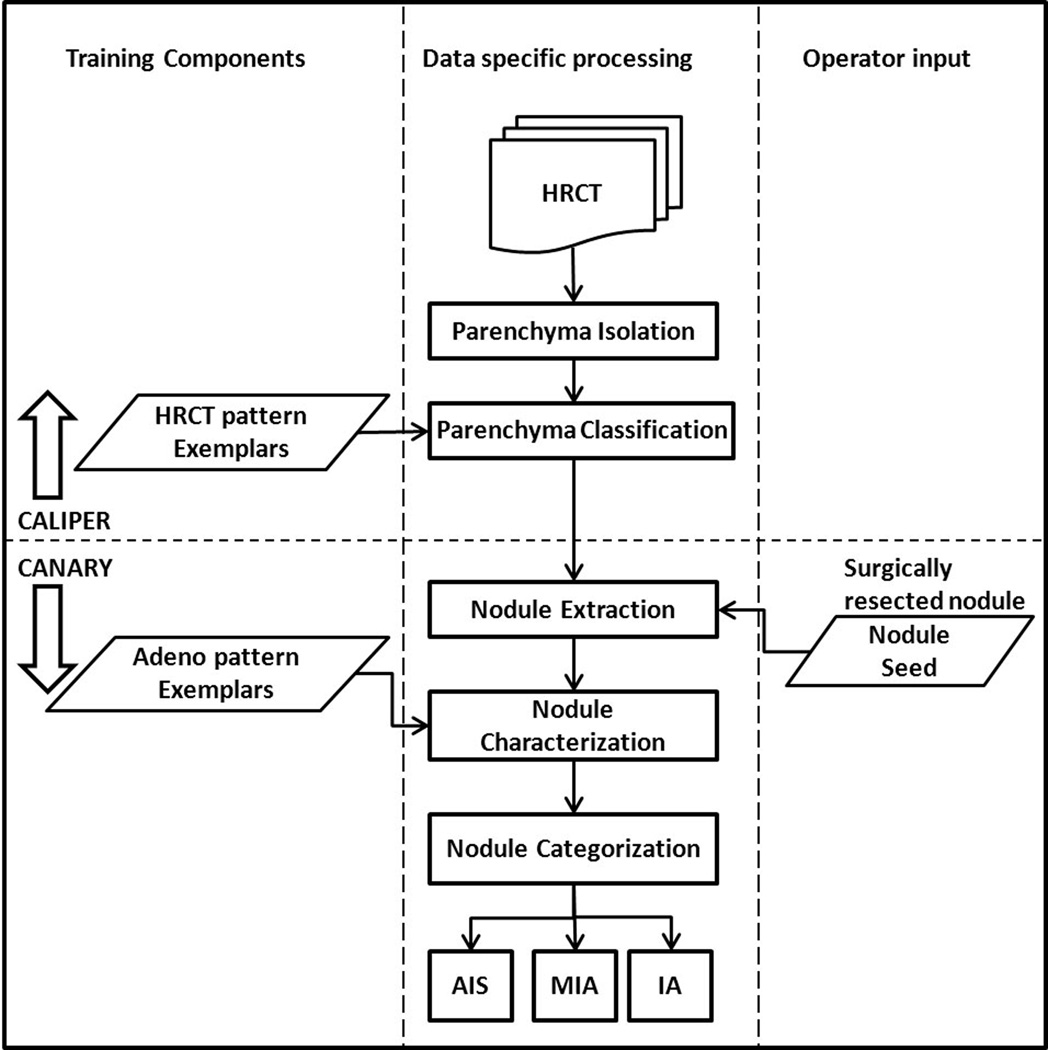
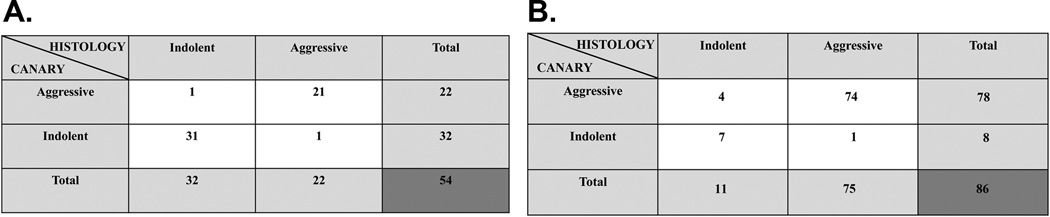
Methods: Radiologic measurements of histopathologic tissue invasion were developed in a training set of 54 pulmonary nodules of the adenocarcinoma spectrum and validated in 86 consecutively resected nodules. Nodules were isolated and characterized by computer-aided analysis, and data were analyzed by Spearman correlation, sensitivity, and specificity and the positive and negative predictive values.
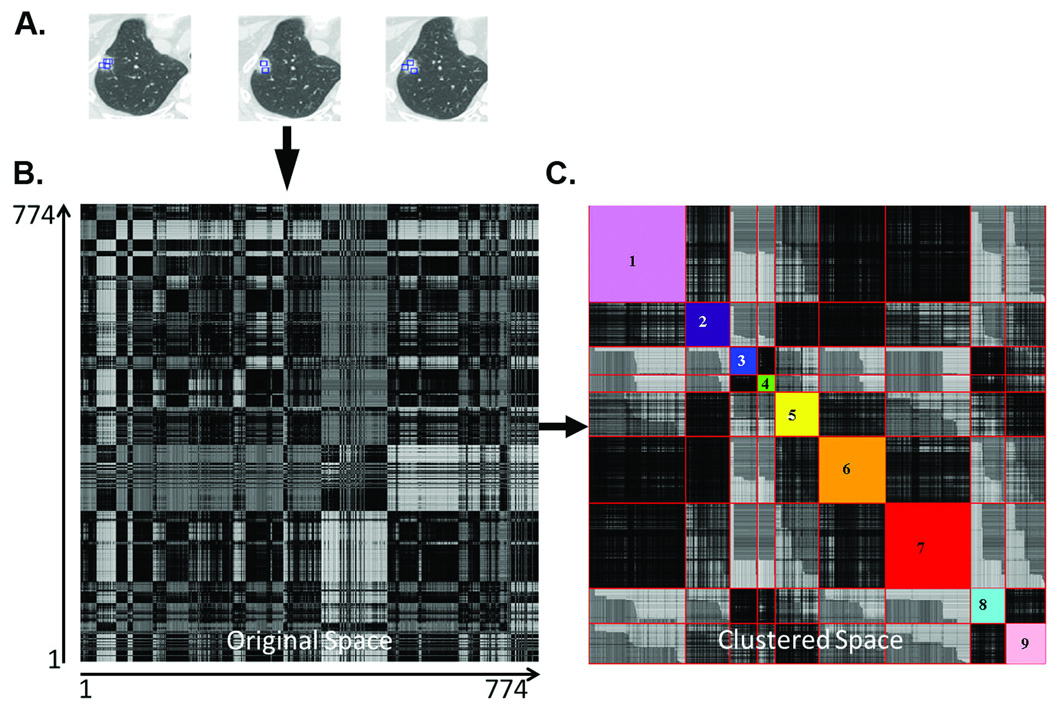
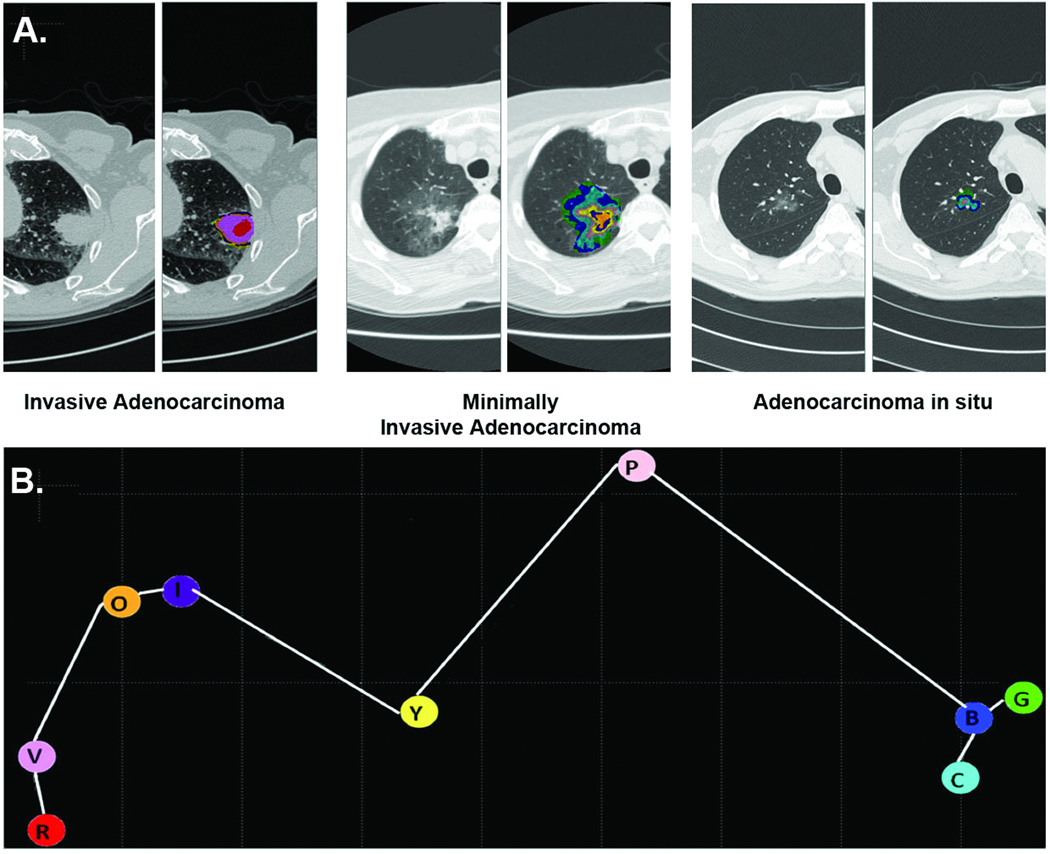
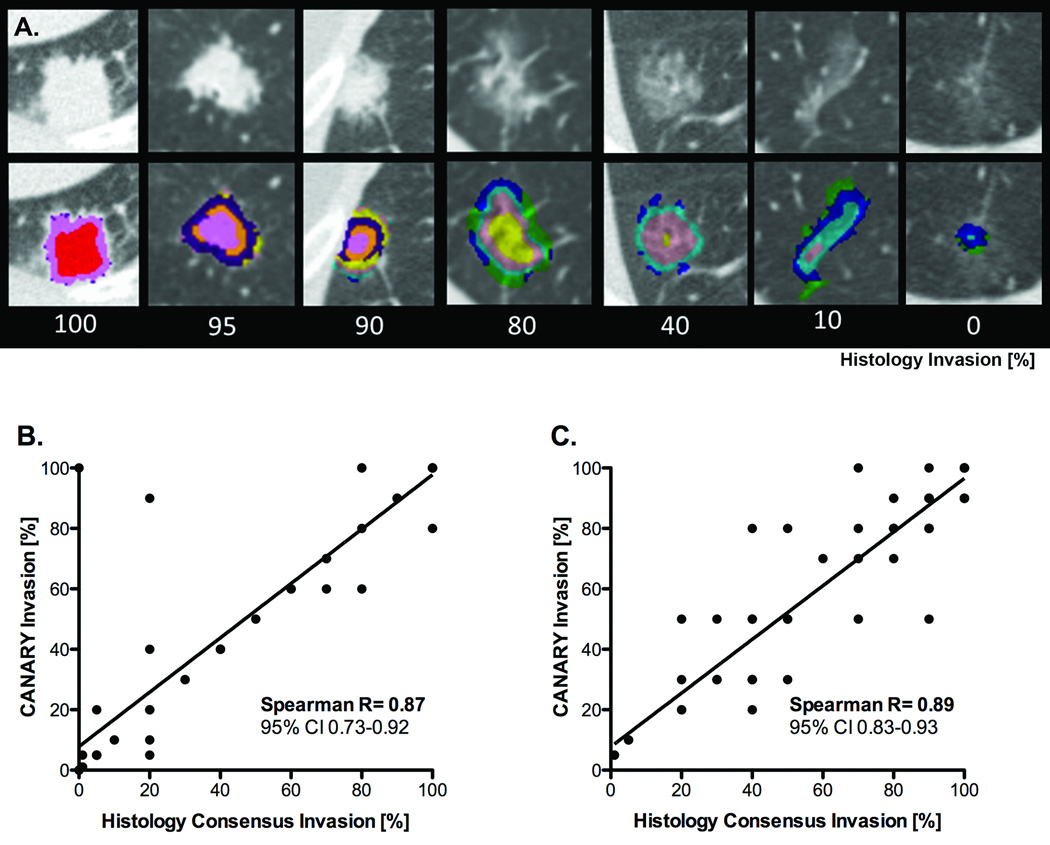
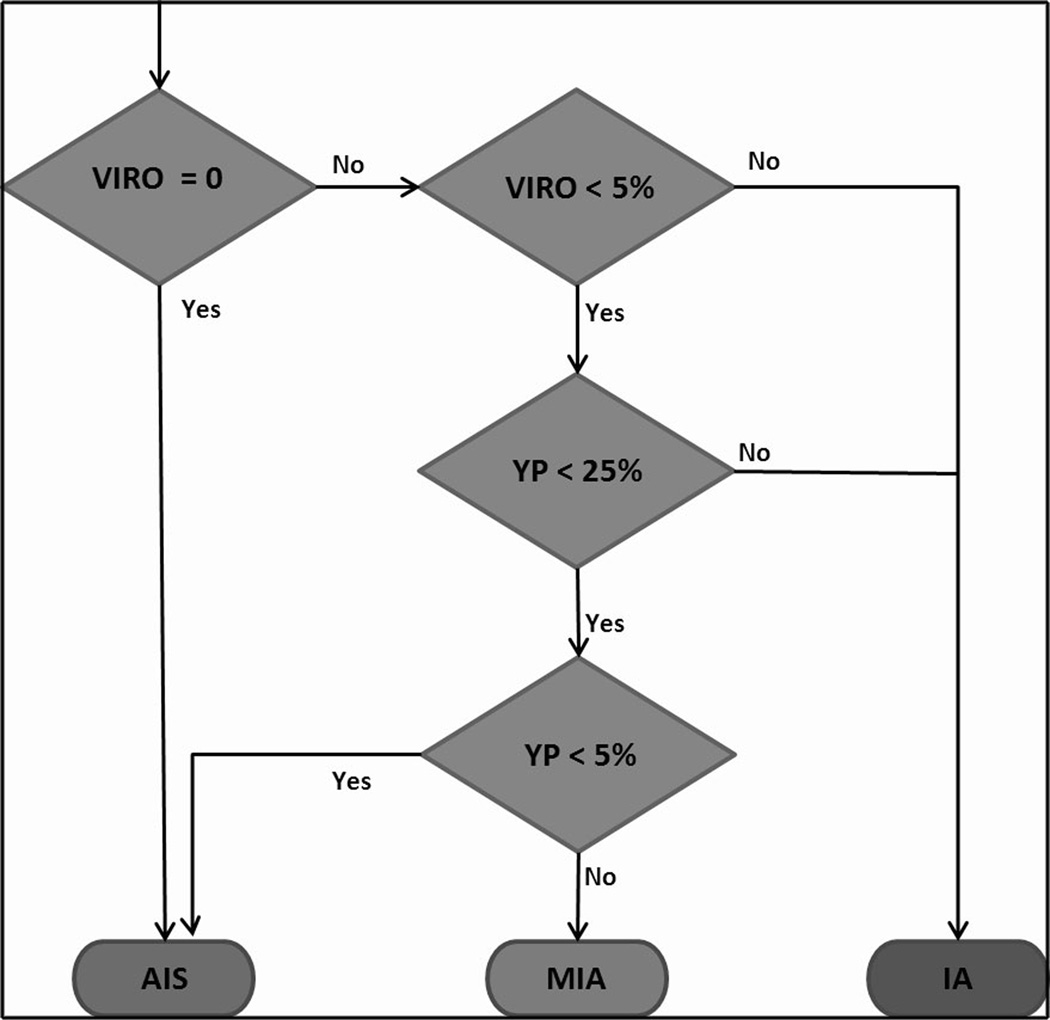
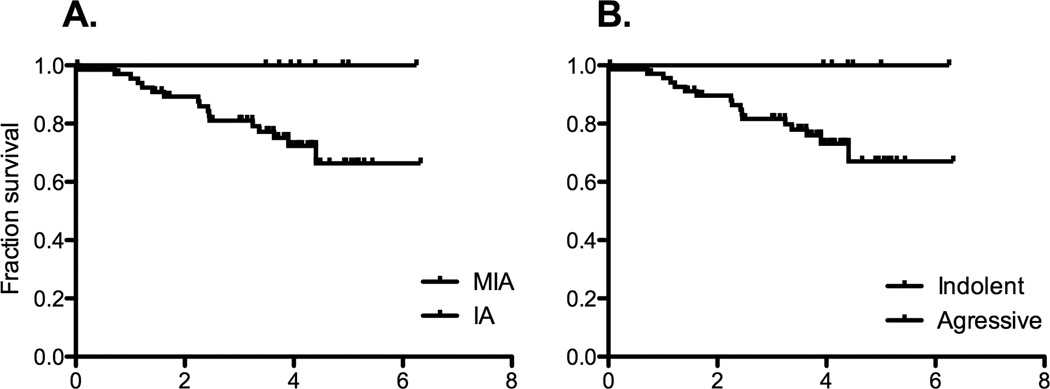
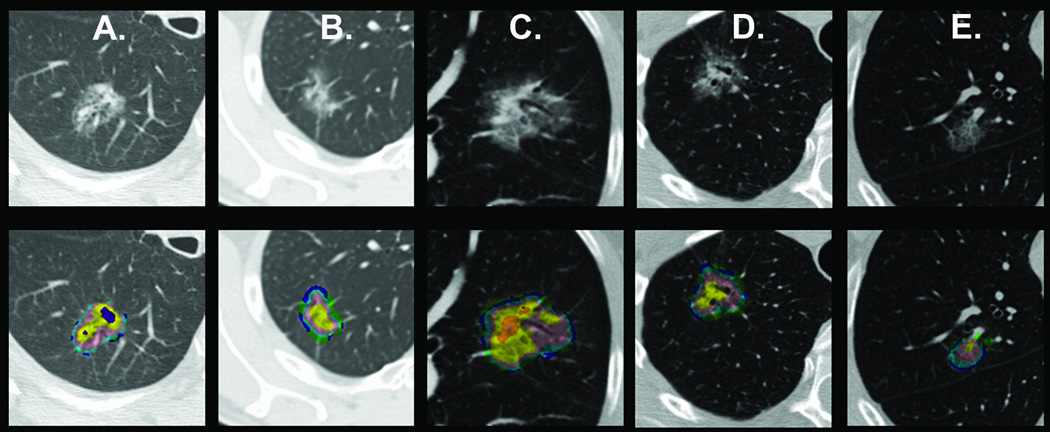
Results: Computer-aided nodule assessment and risk yield (CANARY) can noninvasively characterize pulmonary nodules of the adenocarcinoma spectrum. Unsupervised clustering analysis of high-resolution computed tomography data identified nine unique exemplars representing the basic radiologic building blocks of these lesions. The exemplar distribution within each nodule correlated well with the proportion of histologic tissue invasion, Spearman R = 0.87, p < 0.0001 and 0.89 and p < 0.0001 for the training and the validation set, respectively. Clustering of the exemplars in three-dimensional space corresponding to tissue invasion and lepidic growth was used to develop a CANARY decision algorithm that successfully categorized these pulmonary nodules as "aggressive" (invasive adenocarcinoma) or "indolent" (adenocarcinoma in situ and minimally invasive adenocarcinoma). Sensitivity, specificity, positive predictive value, and negative predictive value of this approach for the detection of aggressive lesions were 95.4, 96.8, 95.4, and 96.8%, respectively, in the training set and 98.7, 63.6, 94.9, and 87.5%, respectively, in the validation set.
Conclusion: CANARY represents a promising tool to noninvasively risk stratify pulmonary nodules of the adenocarcinoma spectrum.
Figures
Comment in
-
The bell tolls for indeterminant lung nodules: computer-aided nodule assessment and risk yield (CANARY) has the wrong tune.J Thorac Dis. 2016 Aug;8(8):E836-7. doi: 10.21037/jtd.2016.07.85. J Thorac Dis. 2016. PMID: 27618999 Free PMC article. No abstract available.
References
-
- Jemal A, Bray F, Center MM, Ferlay J, Ward E, Forman D. Global cancer statistics. CA Cancer J Clin. 2011;61:69–90. - PubMed
-
- Jemal A, Siegel R, Xu J, Ward E. Cancer statistics, 2010. CA Cancer J Clin. 2010;60:277–300. - PubMed
-
- Groome PA, Bolejack V, Crowley JJ, et al. The IASLC Lung Cancer Staging Project: validation of the proposals for revision of the T, N, and M descriptors and consequent stage groupings in the forthcoming (seventh) edition of the TNM classification of malignant tumours. J Thorac Oncol. 2007;2:694–705. - PubMed
-
- Detterbeck FC, Gibson CJ. Turning gray: the natural history of lung cancer over time. J Thorac Oncol. 2008;3:781–792. - PubMed
Publication types
MeSH terms
Grants and funding
LinkOut - more resources
Full Text Sources
Other Literature Sources
Medical
