. 2013 Apr 26;288(17):12102-13.
doi: 10.1074/jbc.M113.456327. Epub 2013 Mar 13.

Electrostatics control actin filament nucleation and elongation kinetics

Affiliations

Electrostatics control actin filament nucleation and elongation kinetics

Alvaro H Crevenna et al. J Biol Chem. .

Abstract

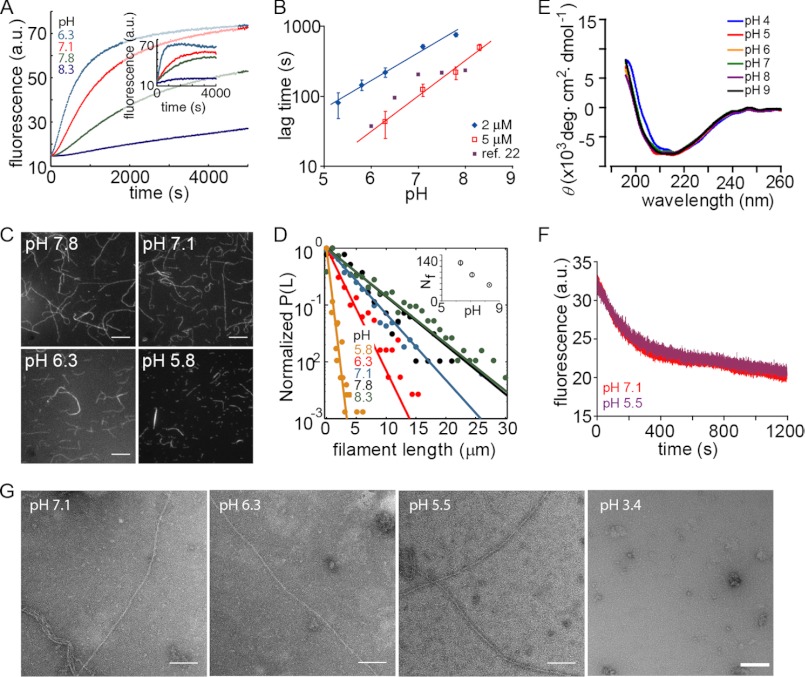
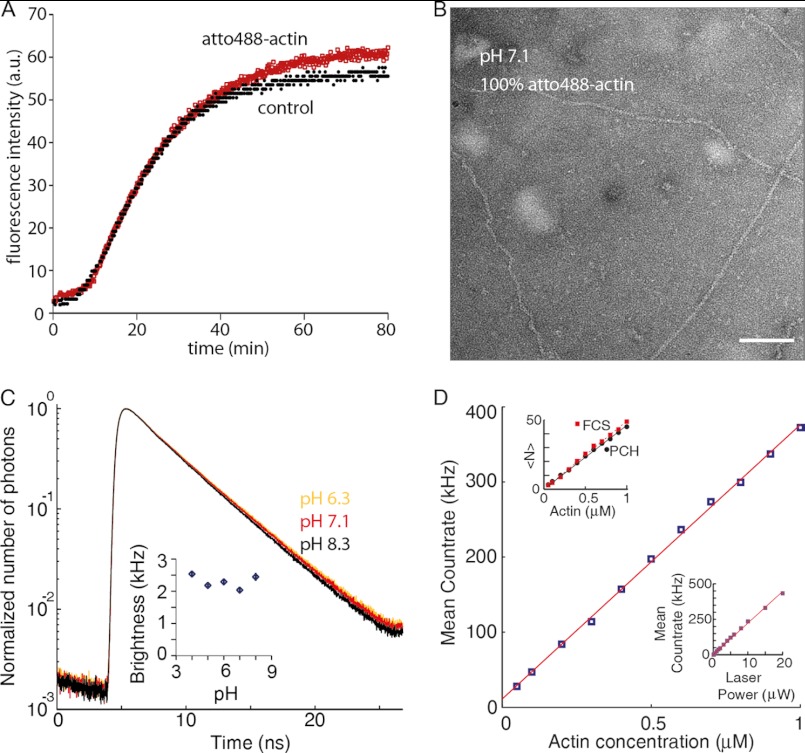
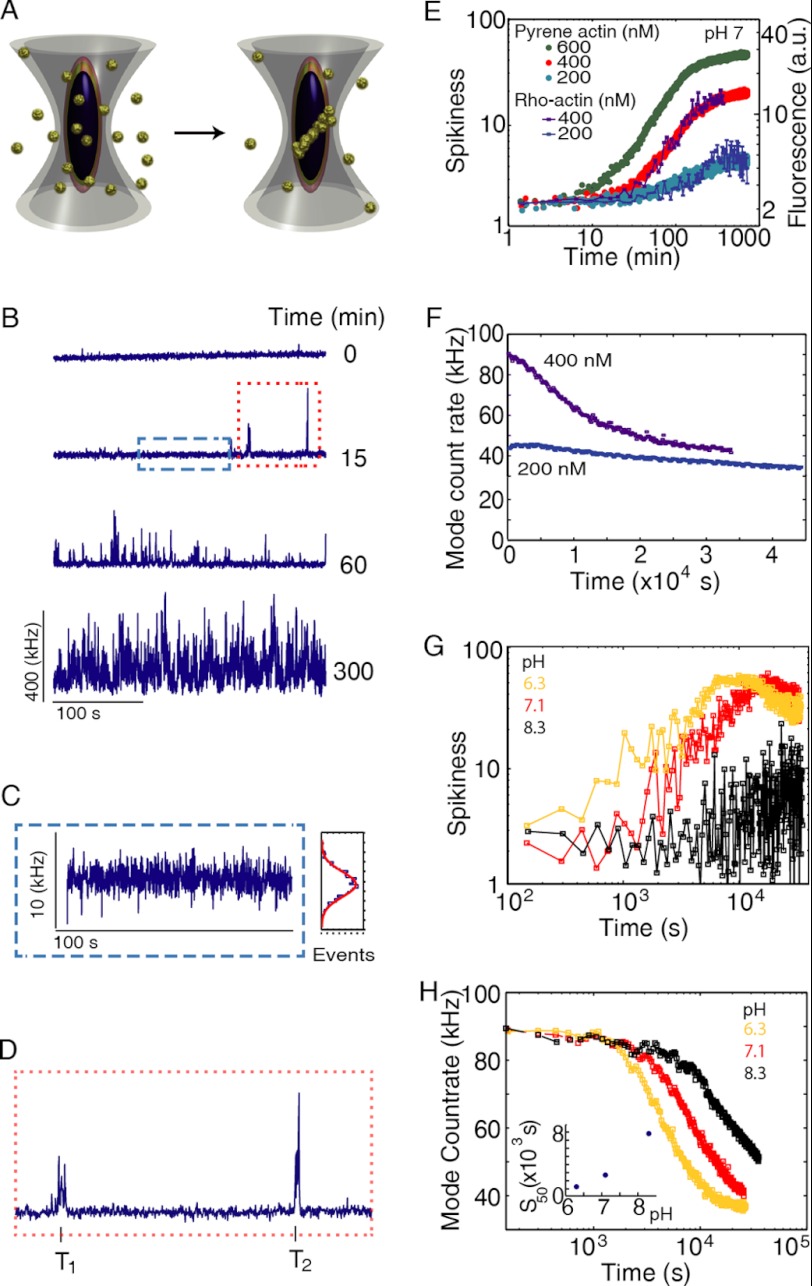
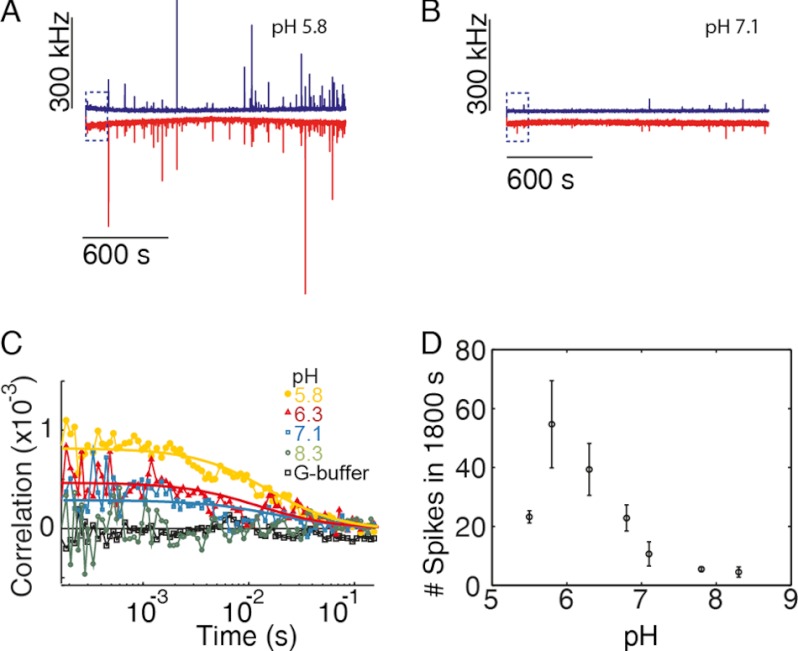
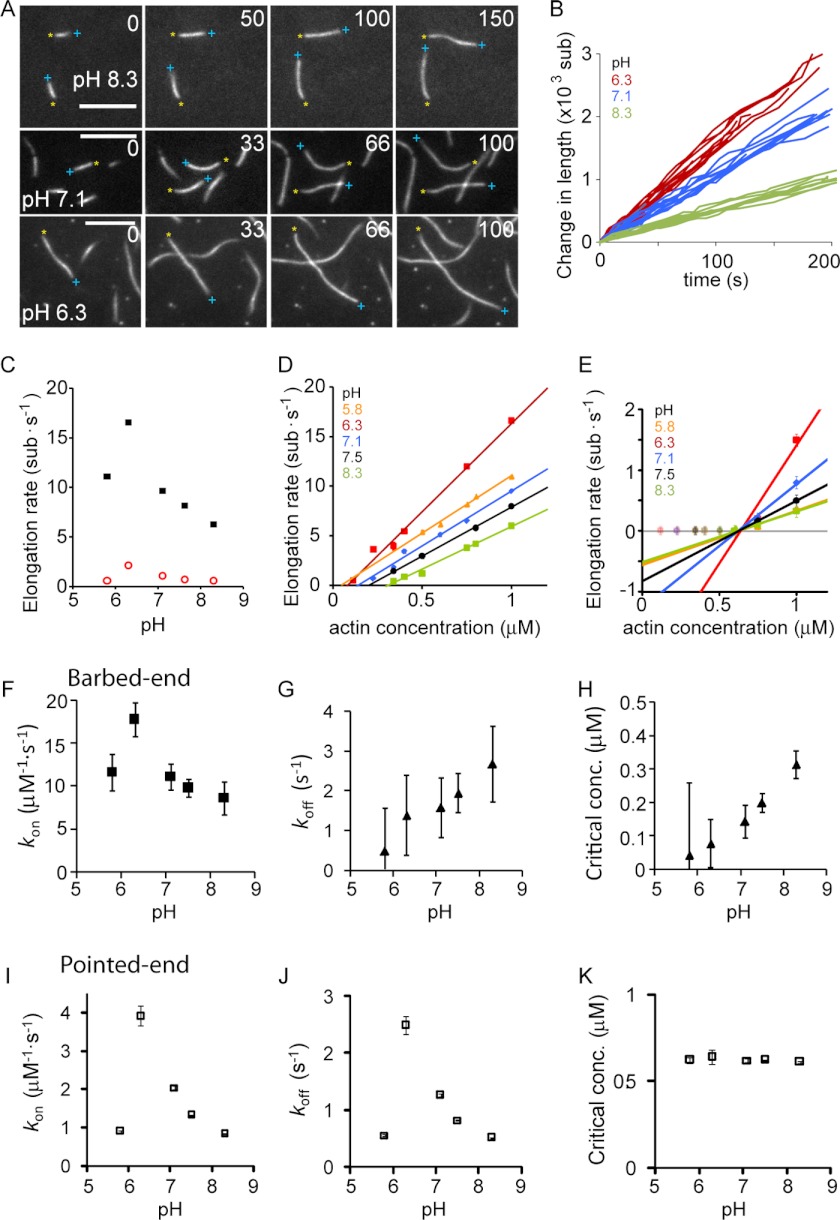
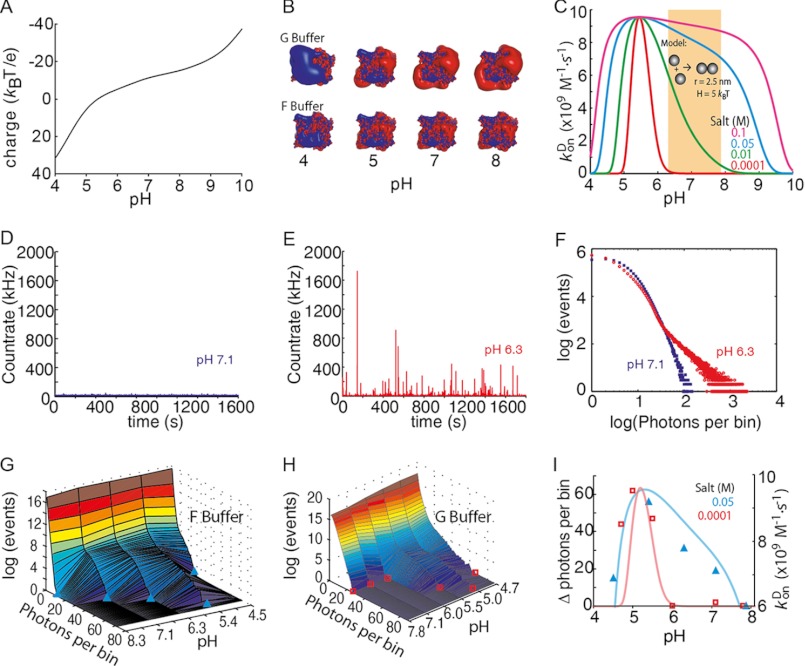
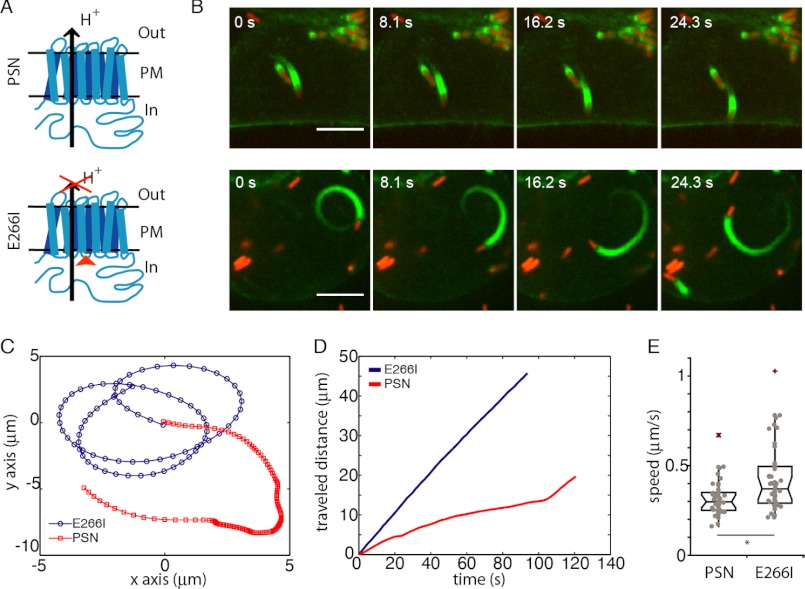
The actin cytoskeleton is a central mediator of cellular morphogenesis, and rapid actin reorganization drives essential processes such as cell migration and cell division. Whereas several actin-binding proteins are known to be regulated by changes in intracellular pH, detailed information regarding the effect of pH on the actin dynamics itself is still lacking. Here, we combine bulk assays, total internal reflection fluorescence microscopy, fluorescence fluctuation spectroscopy techniques, and theory to comprehensively characterize the effect of pH on actin polymerization. We show that both nucleation and elongation are strongly enhanced at acidic pH, with a maximum close to the pI of actin. Monomer association rates are similarly affected by pH at both ends, although dissociation rates are differentially affected. This indicates that electrostatics control the diffusional encounter but not the dissociation rate, which is critical for the establishment of actin filament asymmetry. A generic model of protein-protein interaction, including electrostatics, explains the observed pH sensitivity as a consequence of charge repulsion. The observed pH effect on actin in vitro agrees with measurements of Listeria propulsion in pH-controlled cells. pH regulation should therefore be considered as a modulator of actin dynamics in a cellular environment.


Figures

FIGURE 1.
FIGURE 1.
pH dependence of actin polymerization. A, polymerization kinetics of 2 μm muscle actin (20% pyrene-labeled) at different pH values. Inset, non-muscle actin (2 μm total) with 1% muscle actin pyrene-labeled. B, estimated lag time versus pH for 2 and 5 μm actin. Red and black lines are power law fits with exponents 0.9 (black) and 1.1 (red) and comparison for previously reported data (filled squares) (22). The filled squared data points are taken from Zimmerle and Frieden (22) who measured 10 μm actin in 1.8 mm Mg2+ and 200 μm Ca2+, in contrast to our values of 50 mm KCl and 2 mm MgCl2. C, individual actin filaments polymerized at the indicated pH value. They were stabilized and labeled with Alexa488-phalloidin after polymerization and visualized on a 0.05% polylysine-coated coverslip. D, normalized probability of filament length for actin polymerized at various pH values (>1000 filaments were measured under each condition). Inset, filament number (Nf) measured as a function of pH. Error bars represent S.E. and are within symbol size. E, far-UV circular dichroism measurements with 5 μm actin in P-buffer with pH values between 4 and 9 (see under “Experimental Procedures”. No significant structural change was observed above pH 5. F, 85% pyrene-labeled muscle actin depolymerized in pH 7 buffer after 2 h of polymerization at pH 7.1 (red) or pH 5.5 (purple). G, electron microscopy of actin filaments polymerized at the indicated pH values. a.u., arbitrary units. Scale bar, 100 nm.
FIGURE 2.
FIGURE 2.
Photophysical characterization and polymerization capacity of atto488-labeled actin. A, 2 μm total actin, of which 5% is pyrene-labeled actin, was polymerized under standard conditions in the presence of 95% unlabeled actin (control) or 100% atto488-labeled actin (atto488-actin). B, negative-stain of 100% atto488-actin was polymerized for 1 h and then applied to an EM grid. C, normalized photon count of 400 nm atto488-labeled actin in F-buffer at pH 6.3 (yellow), 7.1 (red), and 8.3 (black). The fluorescence lifetimes are 3.97 ± 0.01, 4.32 ± 0.02, and 4.39 ± 0.02 ns, respectively. Inset, brightness of atto488 measured at 10 microwatts determined using PCH (32). Bars represent S.E. of three independent measurements. D, there is a linear relationship between the actin concentration and the mean count rate; upper inset, the mean number of molecules in the observation volume 〈N〉 (as determined by PCH or FCS) versus actin concentration are shown. Lower inset, the laser power and the mean count rate at 100 nm atto488-actin. a.u., arbitrary units.
FIGURE 3.
FIGURE 3.
Monitoring actin polymerization dynamics with fluorescence fluctuation spectroscopy. A, schematic of the experiment. Actin molecules, each labeled with a single atto488 fluorophore (i.e. 95% labeled), are free in solution as monomers and filaments. The fluorescence intensity will fluctuate as the particles diffuse through the observation volume. B, fluorescence intensity arising from the sample as a function of time after polymerization. Filaments form as a function of time after the start of polymerization. As filaments contain multiple-labeled actin molecules, they will be observed as a spike in fluorescence intensity. 400 nm atto488-labeled actin was polymerized by the addition of one-tenth volume of 10× KMEI at pH 7.1. C, zoom in of the blue box from B. At 1 s temporal binning, the fluorescence signal is absent of spikes and is well described by a Gaussian distribution of intensities with a standard deviation σ. D, zoom in of the red box from B showing the first two spikes. Each individual spike has associated an arrival time T, a duration time, and a number of photons. E, spikiness (i.e. percentage of counts >3σ) versus time for 200, 400, and 600 nm. Shown on the right axis is the pyrene fluorescence increase for a similar concentration of actin. F, mode of counts versus time showing the decrease in monomer concentration upon filament formation. G, spikiness of polymerization at three different pH values. H, decrease of the mode versus pH (data from supplemental Fig. S1, A–C). Inset, time that has elapsed between beginning of the experiment and appearance of the first 50 spikes in seconds as a function of pH.
FIGURE 4.
FIGURE 4.
Actin nucleation is pH-sensitive. 80 nm atto488- and atto647-labeled actin (95 and 50% labeled, respectively) were mixed, and polymerization was started by addition of one-tenth v/v of 10× KMEI buffer. A and B, count rate for the first 1800 s of polymerization at pH 5.8 (A) and 7.1 (B) are shown. Blue indicates the signal from the blue detection channel, and red indicates the signal from the red channel. C, cross-correlation curves from the first 150 s of the above measurements. Solid lines are fits to a single diffusion species in a three-dimensional Gaussian volume to guide the eye. A control sample was measured using G-buffer, where no polymerization occurs. D, number of spikes versus pH during the first 15 min after initiation of polymerization. The error bars are the S.D. from three independent measurements.
FIGURE 5.
FIGURE 5.
Dependence of actin filament elongation kinetics on pH. A, individual filaments (30% atto488-labeled) monitored with time using TIRFM at pH 8.3, 7.1, and 6.3. Barbed ends are marked by a blue plus sign, and pointed ends are marked by a yellow asterisk. All scale bars are 5 μm. B, change of filament length versus time for different filaments measured at the indicated pH values. C, elongation rate of barbed end and pointed end at 1 μm versus pH. Error bars are S.E. D, barbed-end elongation rate versus actin concentration for various pH values. E, pointed-end elongation rate versus actin concentration for various pH values. Only concentration points above 600 nm were used to estimate rate constants (see supplemental material for fits using all data points). F–H, rate constants of barbed-end elongation versus pH as follows: association rate (F), dissociation rate (G), and critical concentration (H). I–K, rate constants of pointed-end elongation versus pH as follows: association rate (I), dissociation rate (J), and critical concentration (K). F–K, error bars were determined from the propagation of errors from the linear fits of the data presented in D and E. At least 25 filaments were measured per condition.
FIGURE 6.
FIGURE 6.
pH-dependent actin electrostatics control polymer formation. A, protein net charge prediction from the atomic structure of muscle actin (Protein Data Bank code 1J6Z) as a function of pH using the protein calculator (see The Scripts website). B, electrostatic map made with the Adaptative Poisson-Boltzmann Solver visualized with PyMOL. Isosurfaces displayed are 2 kT/e in blue and −2 kT/e in red. C, diffusion-controlled kon for dimer formation with actin's pH-defined net charge determined using isoreactive spheres as an approximation for the actin interactions. The orange-shaded region indicates the physiological pH range (see text). D, fluorescence intensity trace for 60 nm atto532-actin in F-buffer at pH 7.1. E, fluorescence intensity trace for 60 nm atto532-actin (80% labeled) in F-buffer at pH 6.3. F, photon-counting histogram analysis (with 1-ms bin size) of the traces shown in D and E. G and H, photon counting histogram versus pH in F-buffer (G) and G-buffer (H). I, difference of the maximum number of photons per bin detected during a measurement at given pH with respect to the measurement at pH 8.3. The light solid curves are taken from C for the same salt concentrations for comparison with its association rate axis on the right.
FIGURE 7.
FIGURE 7.
Effect of pHi on actin polymerization-driven motility of L. monocytogenes. A, schematic of NHE1 and the point mutation that blocks ion translocation of NHE1 while maintaining its ability to interact with adaptor proteins through its long cytoplasmic tail and thereby bind to the cytoskeleton. PM refers to the plasma membrane, Out to the extracellular space, and In to the cytosol. B, single bacteria moving in either a PSN cell (red) (upper panels) or an E266I cell (lower panels). Scale bar, 5 μm. C, representative trajectories of bacterial transport in PSN cells and E266I cells (blue). D, traveled distance as a function of time for the trajectories shown in C. E, boxplot of L. monocytogenes speeds in PSN or E266I cells. n = 46 for each condition, *, p = 0.009.

References

    1. Footer M. J., Kerssemakers J. W., Theriot J. A., Dogterom M. (2007) Direct measurement of force generation by actin filament polymerization using an optical trap. Proc. Natl. Acad. Sci. U.S.A. 104, 2181–2186 - PMC - PubMed
    1. Kovar D. R., Pollard T. D. (2004) Insertional assembly of actin filament barbed ends in association with formins produces piconewton forces. Proc. Natl. Acad. Sci. U.S.A. 101, 14725–14730 - PMC - PubMed
    1. Theriot J. A., Mitchison T. J., Tilney L. G., Portnoy D. A. (1992) The rate of actin-based motility of intracellular Listeria monocytogenes equals the rate of actin polymerization. Nature 357, 257–260 - PubMed
    1. Albiges-Rizo C., Destaing O., Fourcade B., Planus E., Block M. R. (2009) Actin machinery and mechanosensitivity in invadopodia, podosomes, and focal adhesions. J. Cell Sci. 122, 3037–3049 - PMC - PubMed
    1. Schwarz U. S., Gardel M. L. (2012) United we stand: integrating the actin cytoskeleton and cell-matrix adhesions in cellular mechanotransduction. J. Cell Sci. 125, 3051–3060 - PMC - PubMed

Publication types