. 2013 Mar 13;33(11):4657-71.
doi: 10.1523/JNEUROSCI.1119-12.2013.

Enhancing mitochondrial calcium buffering capacity reduces aggregation of misfolded SOD1 and motor neuron cell death without extending survival in mouse models of inherited amyotrophic lateral sclerosis

Affiliations

Enhancing mitochondrial calcium buffering capacity reduces aggregation of misfolded SOD1 and motor neuron cell death without extending survival in mouse models of inherited amyotrophic lateral sclerosis

Philippe A Parone et al. J Neurosci. .

Abstract

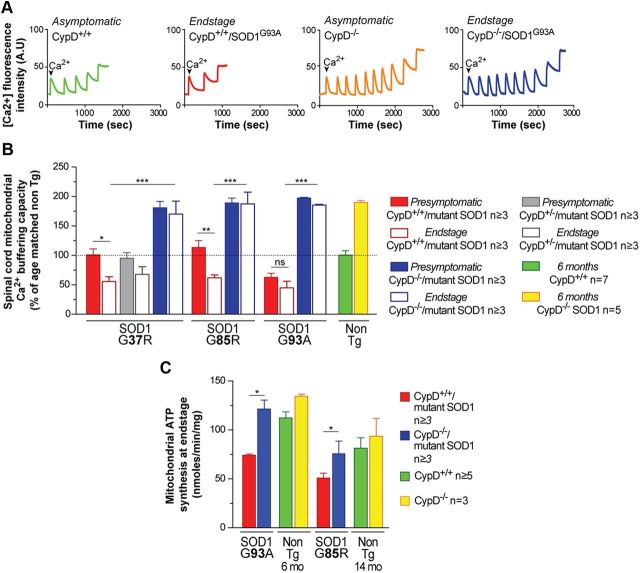
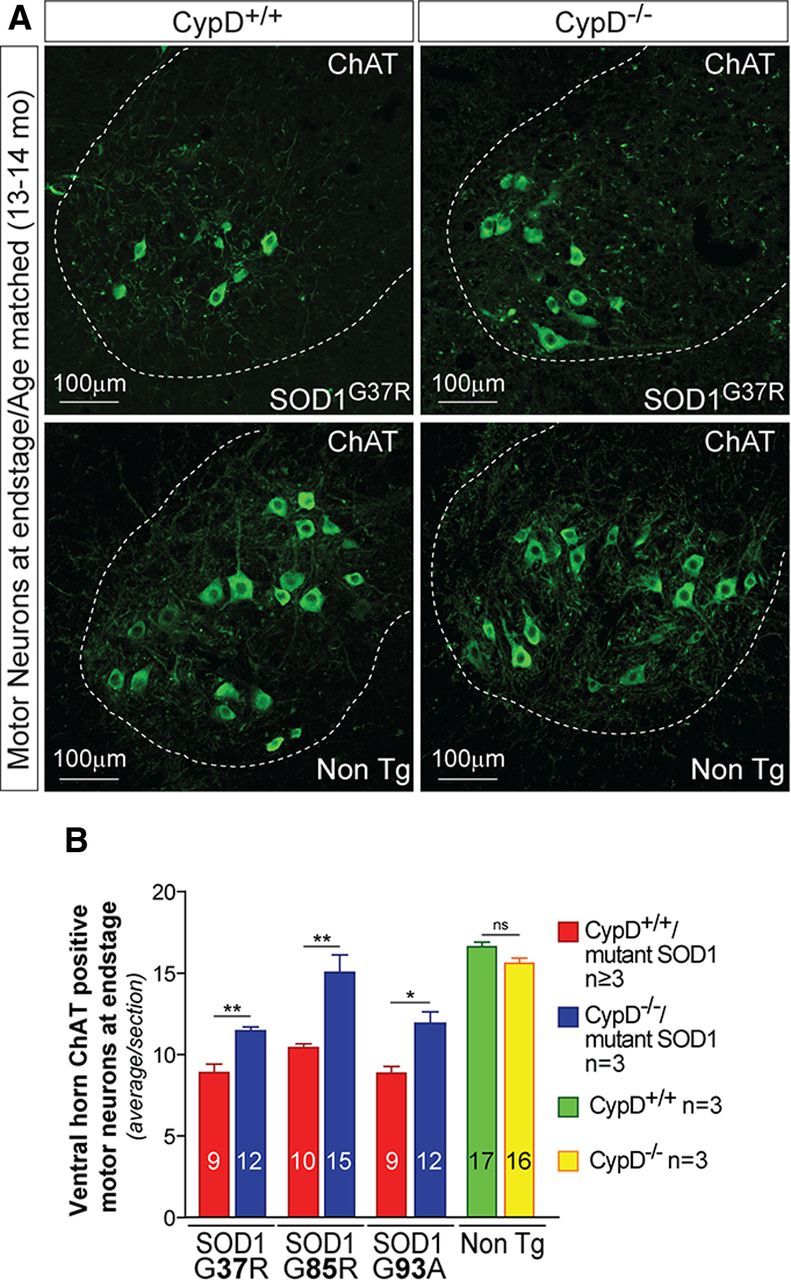
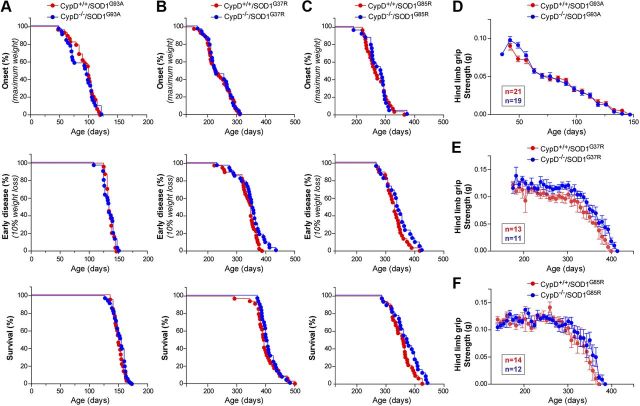
Mitochondria have been proposed as targets for toxicity in amyotrophic lateral sclerosis (ALS), a progressive, fatal adult-onset neurodegenerative disorder characterized by the selective loss of motor neurons. A decrease in the capacity of spinal cord mitochondria to buffer calcium (Ca(2+)) has been observed in mice expressing ALS-linked mutants of SOD1 that develop motor neuron disease with many of the key pathological hallmarks seen in ALS patients. In mice expressing three different ALS-causing SOD1 mutants, we now test the contribution of the loss of mitochondrial Ca(2+)-buffering capacity to disease mechanism(s) by eliminating ubiquitous expression of cyclophilin D, a critical regulator of Ca(2+)-mediated opening of the mitochondrial permeability transition pore that determines mitochondrial Ca(2+) content. A chronic increase in mitochondrial buffering of Ca(2+) in the absence of cyclophilin D was maintained throughout disease course and was associated with improved mitochondrial ATP synthesis, reduced mitochondrial swelling, and retention of normal morphology. This was accompanied by an attenuation of glial activation, reduction in levels of misfolded SOD1 aggregates in the spinal cord, and a significant suppression of motor neuron death throughout disease. Despite this, muscle denervation, motor axon degeneration, and disease progression and survival were unaffected, thereby eliminating mutant SOD1-mediated loss of mitochondrial Ca(2+) buffering capacity, altered mitochondrial morphology, motor neuron death, and misfolded SOD1 aggregates, as primary contributors to disease mechanism for fatal paralysis in these models of familial ALS.


Figures

Figure 1.
Figure 1.
Deleting cyclophilin D improves mitochondrial calcium buffering capacity and mitochondrial ATP synthesis throughout disease in mutant SOD1-expressing mice. A, Representative traces of mitochondrial Ca2+ uptake capacity from spinal cords of asymptomatic nontransgenic animals (CypD+/+; green) (CypD−/−; orange) and from end stage CypD+/+/SOD1G93A (red) and CypD−/−/SOD1G93A (blue) animals. The peaks correspond to sequential bolus additions of 30 nmol of Ca2+. The downward deflections reflect mitochondrial Ca2+ uptake. B, Relative Ca2+ capacity of mitochondria isolated from spinal cords of CypD+/+/mutant SOD1 and CypD−/−/mutant SOD1 animals at the presymptomatic stage and end stage of disease. The bar graph represents mean ± SEM. *p < 0.05, **p < 0.01, ***p < 0.001; ns: p > 0.05. The dotted line at 100% corresponds to Ca2+ capacity of mitochondria isolated from spinal cords of age-matched nontransgenic control animals (CypD+/+, green; CypD−/−, yellow). C, Levels of ATP synthesis in mitochondria isolated from spinal cords of CypD+/+/mutant SOD1 and CypD−/−/mutant SOD1 animals at end stage disease and from age-matched nontransgenic controls at 6 and 14 months of age. The bar graph represents mean ± SEM. *p < 0.05.
Figure 2.
Figure 2.
Deleting cyclophilin D reduces mitochondrial damage in spinal cord motor neurons throughout disease in mutant SOD1-expressing mice. A, Electron micrographs of motor neuron mitochondria from cross-sections of spinal cords from CypD+/+/SOD1G93A and CypD−/−/SOD1G93A animals at a symptomatic stage of disease and from nontransgenic age-matched controls. Scale bar, 1 μm. B, Average area of mitochondria in spinal cord motor neurons of CypD+/+/SOD1G93A and CypD−/−/SOD1G93A animals at a symptomatic stage of disease and in nontransgenic age-matched controls. The bar graph represents mean ± SEM. ***p < 0.001. C, Distribution of mitochondrial area as a percentage of total mitochondrial population analyzed in B. The percentage of mitochondria with area >1.1 μm2 for each genotype is represented in the bar graph. D, Average area of mitochondrial intracristae space in spinal cord motor neurons of CypD+/+/SOD1G93A and CypD−/−/SOD1G93A animals at a symptomatic stage of disease and in nontransgenic age-matched controls. The bar graph represents mean ± SEM. ***p < 0.001.
Figure 3.
Figure 3.
Deleting cyclophilin D reduces mitochondrial damage and degeneration in lumbar motor axons throughout disease in mutant SOD1-expressing mice. A, Electron micrographs of mitochondria from cross sections of lumbar L5 motor axon from CypD+/+/SOD1G93A and CypD−/−/SOD1G93A animals at a symptomatic stage of disease and from nontransgenic age-matched controls. Scale bar, 1 μm. B, Electron micrographs of mitochondria from cross sections of lumbar L5 motor axon from CypD+/+/SOD1G93A animals at a symptomatic stage of disease. Scale bar, 250 nm. 1 illustrates an example of a healthy mitochondrion and 2–5 illustrate representative examples of damaged mitochondria: mitochondria with disorganized cristae (2), degenerating within vacuoles (3), with diluted (low electron density) matrix, (4) or abnormal distention between the inner and outer membranes with rupture of the outer membrane (5). C, Average area of mitochondria in lumbar motor axons of CypD+/+/SOD1G93A and CypD−/−/SOD1G93A animals at a symptomatic stage of disease and in nontransgenic age-matched controls. The bar graph represents mean ± SEM. ***p < 0.001. D, Distribution of mitochondrial area as a percentage of the total mitochondrial population analyzed in C. The percentage of mitochondria with area >1.1 μm2 for each genotype is represented in the bar graph. E, Percentage of damaged mitochondria with the type of damage illustrated in B (2–5) in lumbar motor axons of CypD+/+/SOD1G93A and CypD−/−/SOD1G93A animals at a symptomatic stage of disease and in nontransgenic age-matched controls. The bar graph represents mean ± SEM. ***p < 0.001.
Figure 4.
Figure 4.
Improving mitochondrial function by deleting CypD in mutant SOD1 animals does not prevent muscle denervation and axonal degeneration. A, Representative micrographs of gastrocnemius muscle from CypD+/+/SOD1G37R and CypD−/−/SOD1G37R animals at end stage disease and from age-matched nontransgenic littermates processed for immunofluorescence to reveal axons (red) using an antibody recognizing synaptophysin and fluoromyelin red and using α-bungarotoxin (green) to reveal muscle endplates. Scale bar, 20 μm. B, Representative micrographs of lumbar motor axons from CypD+/+/SOD1G37R and CypD−/−/SOD1G37R animals at end stage disease and from age-matched nontransgenic littermates. Scale bar, 25 μm. C, Quantification of innervation at the NMJ of the gastrocnemius muscle from CypD+/+/mutant SOD1 and CypD−/−/mutant SOD1 animals throughout disease stages for mutant SOD1G37R and at end stage for CypD+/+/SOD1G85R, CypD−/−/SOD1G85R, and age-matched nontransgenic littermates. The bar graph represents mean ± SEM. ns: p > 0.05. D, Quantification of the total number of α-motor axons in the lumbar L5 motor root from CypD+/+/mutant SOD1 and CypD−/−/mutant SOD1 animals at a symptomatic stage and at end stage of disease.
Figure 5.
Figure 5.
Improving mitochondrial function by deleting CypD in mutant SOD1 animals significantly reduces the loss of motor neurons. A, Representative micrographs of lumbar spinal cord sections from CypD+/+/mutant SOD1 and CypD−/−/mutant SOD1 animals at end stage of disease and from age-matched nontransgenic littermates processed for immunofluorescence using an antibody recognizing ChAT to reveal cholinergic motor neurons. Dashed outlines correspond to the boundary between gray and white matter. Scale bar, 100 μm. B, Quantification of the average number of large cholinergic ventral horn motor neurons per section of lumbar spinal cord from CypD+/+/mutant SOD1 and CypD−/−/mutant SOD1 animals at end stage disease and in age-matched nontransgenic littermates. The bar graph represents mean ± SEM. *p < 0.05, **p > 0.01; ns: p > 0.05. The number within each bar represents the average number of motor neurons per spinal cord section.
Figure 6.
Figure 6.
Improving mitochondrial function by deleting CypD in mutant SOD1 animals significantly reduces glial activation. A, Representative micrographs of lumbar spinal cord sections from CypD+/+/mutant SOD1 and CypD−/−/mutant SOD1 animals at a symptomatic stage of disease processed for immunofluorescence using an antibody detecting activated microglia (IbaI). Dashed outlines correspond to the boundary between gray and white matter. Scale bar, 100 μm. B, Quantification of the relative fluorescence intensity of the IbaI staining of lumbar spinal cord from CypD+/+/mutant SOD1 and CypD−/−/mutant SOD1 animals at a symptomatic stage of disease. The bar graph represents mean ± SEM. **p < 0.01, ***p < 0.001. C, Representative micrographs of lumbar spinal cord sections from CypD+/+/mutant SOD1 and CypD−/−/mutant SOD1 animals at symptomatic stage of disease processed for immunofluorescence using an antibody-detecting activated astrocytes (GFAP). Dashed outlines correspond to the boundary between gray and white matter. Scale bar, 100 μm. D, Quantification of the relative fluorescence intensity of the GFAP staining of lumbar spinal cord from CypD+/+/mutant SOD1 and CypD−/−/mutant SOD1 animals at a symptomatic stage of disease. The bar graph represents mean ± SEM. **p < 0.01, ***p < 0.001.
Figure 7.
Figure 7.
Improving mitochondrial function by deleting CypD in mutant SOD1 animals reduces the accumulation of misfolded forms of mutant SOD1 in the spinal cord at a symptomatic stage of disease. A, C, D, Representative micrographs of lumbar spinal cord sections from CypD+/+/mutant SOD1 and CypD−/−/mutant SOD1 animals at a symptomatic stage of disease processed for immunofluorescence using an antibody-detecting misfolded SOD1: B8H10 (A), A5C3 and D3H5 (C), DSE2 (D). Dashed outlines correspond to the boundary between gray and white matter. Scale bar, 100 μm. B, Quantification of the relative fluorescence intensity of the B8H10 (A) and DSE2 (D) stainings of lumbar spinal cord from CypD+/+/mutant SOD1 and CypD−/−/mutant SOD1 animals at a symptomatic stage of disease. The bar graph represents mean ± SEM. **p < 0.01, ***p < 0.001.
Figure 8.
Figure 8.
Improving mitochondrial function by deleting CypD in mutant SOD1 animals reduces the accumulation of misfolded SOD1 aggregates in whole spinal cord lysates and on the surface of spinal cord mitochondria. A, Schematic outlining the different purification steps used. Whole spinal cord lysate (B) from CypD+/+ or CypD−/− mutant SOD1 mice or mitochondria-enriched heavy membrane fraction (C, D) from spinal cords of CypD+/+ or CypD−/− mutant SOD1 mice were immunoprecipitated with an antibody specifically detecting misfolded forms of SOD1 (B8H10). Whole spinal cord lysate from CypD+/+ or CypD-/- mutant SOD1 mice was fractionated using size exclusion chromatography (E). B, Immunoblot of whole tissue extracts and the misfolded SOD1 immunoprecipitated from clarified spinal cord extract using the indicated antibodies. C, D, Immunoblot of the misfolded SOD1 immunoprecipitated from a heavy membrane fraction of spinal cords enriched in mitochondria. E, Immunoblot of SOD1 containing fractions separated by size exclusion chromatography and resolved by slot blot from spinal cord homogenates of CypD+/+ or CypD−/− mutant SOD1 mice. The molecular weight of each fraction was estimated from the separation of the indicated recombinant proteins.
Figure 9.
Figure 9.
Improving mitochondrial function by deleting CypD in mutant SOD1 animals does not alter disease course. A–C, Plot of ages (in days) at which disease onset (as determined by the weight peaks. At onset animals do not display any obvious motor phenotype), symptomatic stage (as determined by 10% weight loss from onset. This disease stage is characterized by clear gait abnormalities and tremor) and end stage (as determined by hindlimb paralysis and inability right itself) were reached for CypD+/+/mutant SOD1 (red) and CypD−/−/mutant SOD1 (blue) animals. D–F, Plot of averaged grip strength for CypD+/+/mutant SOD1 (red) and CypD−/−/mutant SOD1 (blue) animals at indicated age.

References

    1. Alexianu ME, Kozovska M, Appel SH. Immune reactivity in a mouse model of familial ALS correlates with disease progression. Neurology. 2001;57:1282–1289. - PubMed
    1. Arrasate M, Mitra S, Schweitzer ES, Segal MR, Finkbeiner S. Inclusion body formation reduces levels of mutant huntingtin and the risk of neuronal death. Nature. 2004;431:805–810. - PubMed
    1. Azzolin L, von Stockum S, Basso E, Petronilli V, Forte MA, Bernardi P. The mitochondrial permeability transition from yeast to mammals. FEBS Lett. 2010;584:2504–2509. - PMC - PubMed
    1. Baines CP, Kaiser RA, Purcell NH, Blair NS, Osinska H, Hambleton MA, Brunskill EW, Sayen MR, Gottlieb RA, Dorn GW, Robbins J, Molkentin JD. Loss of cyclophilin D reveals a critical role for mitochondrial permeability transition in cell death. Nature. 2005;434:658–662. - PubMed
    1. Barrientos SA, Martinez NW, Yoo S, Jara JS, Zamorano S, Hetz C, Twiss JL, Alvarez J, Court FA. Axonal degeneration is mediated by the mitochondrial permeability transition pore. J Neurosci. 2011;31:966–978. - PMC - PubMed

Publication types

MeSH terms