. 2013 Mar 13;33(11):4672-82.
doi: 10.1523/JNEUROSCI.2922-12.2013.

Spontaneous and task-evoked brain activity negatively interact

Affiliations

Spontaneous and task-evoked brain activity negatively interact

Biyu J He. J Neurosci. .

Abstract

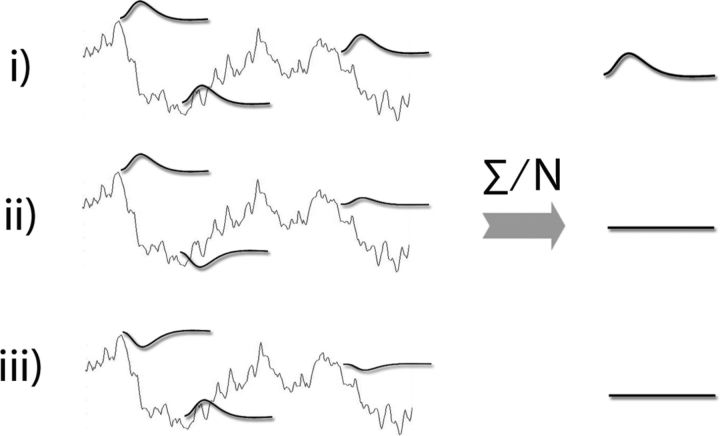
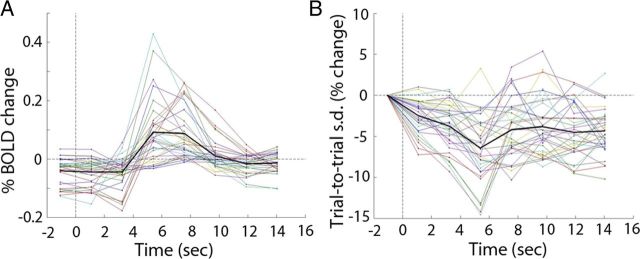
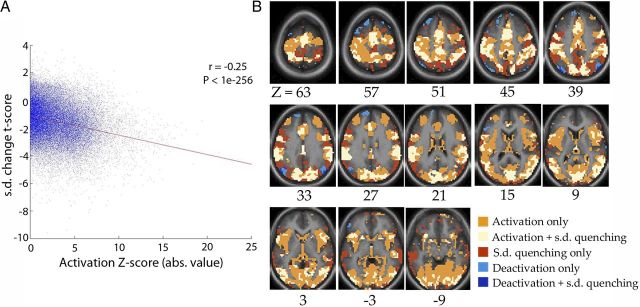
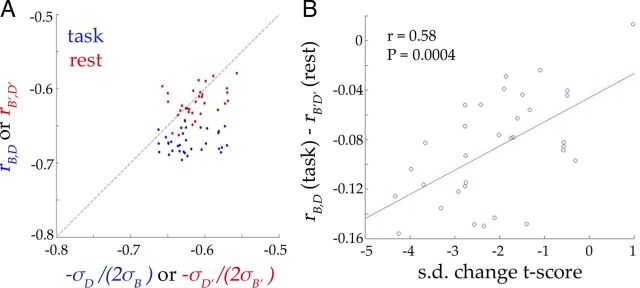
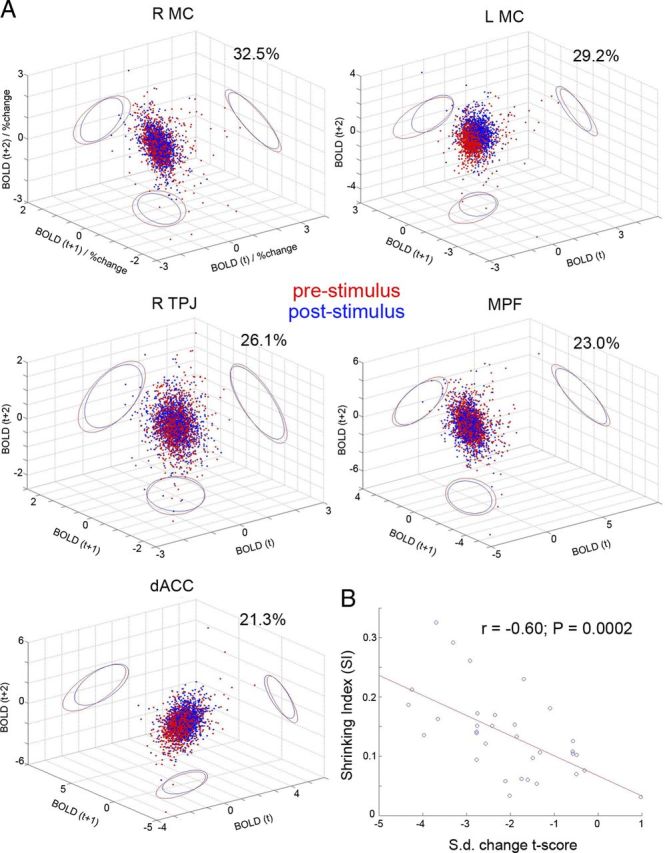
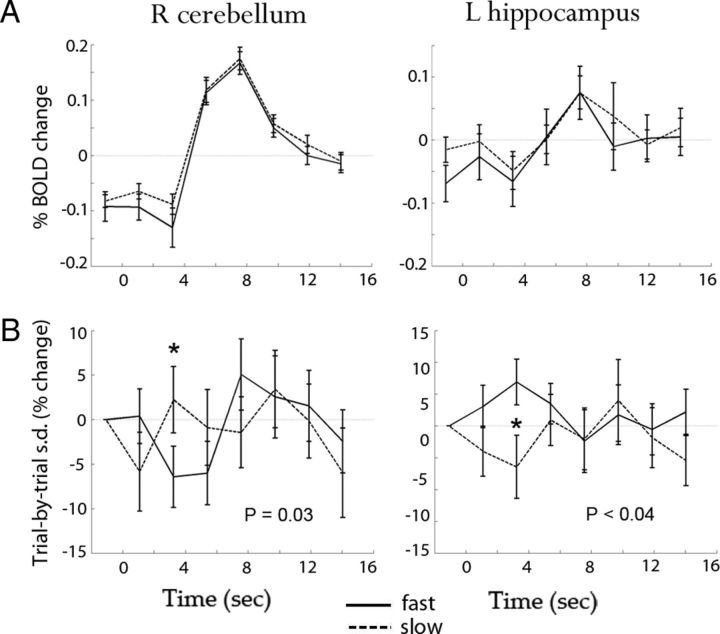
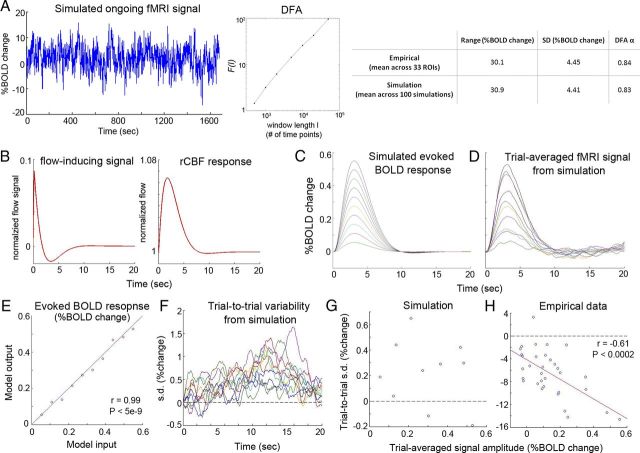
A widely held assumption is that spontaneous and task-evoked brain activity sum linearly, such that the recorded brain response in each single trial is the algebraic sum of the constantly changing ongoing activity and the stereotypical evoked activity. Using functional magnetic resonance imaging signals acquired from normal humans, we show that this assumption is invalid. Across widespread cortices, evoked activity interacts negatively with ongoing activity, such that higher prestimulus baseline results in less activation or more deactivation. As a consequence of this negative interaction, trial-to-trial variability of cortical activity decreases following stimulus onset. We further show that variability reduction follows overlapping but distinct spatial pattern from that of task-activation/deactivation and it contains behaviorally relevant information. These results favor an alternative perspective to the traditional dichotomous framework of ongoing and evoked activity. That is, to view the brain as a nonlinear dynamical system whose trajectory is tighter when performing a task. Further, incoming sensory stimuli modulate the brain's activity in a manner that depends on its initial state. We propose that across-trial variability may provide a new approach to brain mapping in the context of cognitive experiments.


Figures

Figure 1.
Figure 1.
ROIs and task-activation/deactivation pattern. A, Thirty-one ROIs are color-coded by the networks they belong to. Non-neocortical regions included the left and right hippocampi, left and right thalami, and the right cerebellum. B, Task-activation and task-deactivation patterns obtained from whole-brain voxelwise analysis. Random-effects analysis across subjects (for peak frame at 5.4 s against the prestimulus frame) was used to obtain the Z-score.
Figure 2.
Figure 2.
Schematics illustrating three different models about the relationship between ongoing and evoked activity: i, No interaction (also called “linear superposition”). ii, Positive interaction. iii, Negative interaction. The ongoing activity is shown in gray. Evoked responses in single trials are shown in black. Recorded brain signal in an experiment is the sum of these two. The right side of the graph shows the results of averaging across trials. For ii and iii, only one potential scenario is depicted. For example, all of single-trial responses could be activation, but the magnitude of which still positively or negatively correlates with ongoing activity. Note that the complete cancellation as depicted here is an ideal situation.
Figure 3.
Figure 3.
A, B, Trial-averaged fMRI signal (A) and across-trial SD (B) time courses for the 33 ROIs. Each line represents one ROI (averaged across subjects). Thick black lines show the average across ROIs.
Figure 4.
Figure 4.
Whole-brain voxelwise analysis. A, Correlation SD change t score (t test across subjects) and task-activation Z-score (absolute value, random-effects analysis across subjects) across all voxels in the gray matter [defined by a gray-matter mask created from the atlas image; number of voxels (N), 42,001]. Both measures were assessed for peak frame at 5.4 s versus the prestimulus frame. Each dot represents one voxel. Red line indicates best linear-regression fit. B, Spatial patterns of voxels showing significant task activation/deactivation (orange and light blue respectively), significant SD decrease (red), and the overlap between them respectively (white and deep blue).
Figure 5.
Figure 5.
Interaction between ongoing and evoked activity. A, rB,D is the correlation between B and D values across trials. σB and σD are the SDs of B and D values across trials respectively. rB′,D′, σB′, and σD′ are calculated using surrogate trials from rest data. Each dot represents one ROI (red, rest data; blue, task data). B, Correlation between SD change t score (paired t test on SD between peak frame at 5.4 s and the prestimulus frame) and the difference between rB,D and rB′,D′ (both Fisher z transformed) across ROIs. Red line indicates the best linear-regression fit.
Figure 6.
Figure 6.
Cortical activity space analysis. A, Visualization of the prestimulus (red) and poststimulus (blue) activity across trials for selected ROIs. Data from all subjects were pooled together. Each dot represents one trial; ellipses show the 95% confidence interval of the distribution projected onto two-dimensional planes (red, prestimulus; blue, poststimulus). The SI is indicated in each graph. MC, Primary hand-motor cortex; TPJ, temporoparietal junction; MPF, medial prefrontal cortex; dACC, dorsal anterior cingulate cortex. B, Correlation between SI and the SD change t score. Each dot represents one ROI; the red line indicates the best linear-regression fit.
Figure 7.
Figure 7.
A, B, Trial-averaged fMRI signal (A) and across-trial SD (B) time courses for fast (solid lines) and slow (dashed lines) trials in the right cerebellum (left column) and the left hippocampus (right column). Results were averaged across subjects; error bars indicate SEM. p values are from a paired t test across subjects on across-trial SD between fast and slow trials.
Figure 8.
Figure 8.
Hemodynamic response modeling. A, An example of simulated ongoing fMRI signal (left) and its detrended fluctuation analysis (DFA) result (middle). Right, the fluctuation magnitude, as assessed by range and SD, as well as the DFA exponent α (which estimates directly the Hurst exponent H) are compared between simulated data and real data from resting-state study. B, Input to the balloon model for the evoked component, following Friston et al. (2000). rCBF, regional CBF. C, Simulated evoked BOLD response from the balloon model, with only the evoked CBF response as input. Ten different response amplitudes were simulated. D, Trial-averaged BOLD signals from the full balloon model, with the input including both ongoing CBF activity and evoked CBF responses. E, Correlation between the peak amplitudes of evoked BOLD response simulated in isolation (abscissa value, from C) and the trial-averaged response from the full model (ordinate value, from D). Red line indicates the unity line. F, Trial-to-trial variability (SD) time courses. As for real data, SD time courses were normalized to its value at stimulus onset. Traces in different colors show results from 10 different input amplitude values. G, Relationship between the peak amplitude of the trial-averaged responses (abscissa) and trial-to-trial variability at the same time point (ordinate) across 10 input amplitude values (r = −0.2; p = 0.58). H, Correlation between the peak amplitude of the trial-averaged responses (abscissa) and trial-to-trial variability (ordinate) at the same time point (5.4 s following stimulus onset) across 33 ROIs.

Comment in

References

    1. Abbott LF, Rajan K, Sompolinksy H. Interactions between intrinsic and stimulus-dependent activity in recurrent neural networks. In: Ding M, Glanzman D, editors. The dynamic brain: an exploration of neuronal variability and its functional significance. New York: Oxford UP; 2011.
    1. Arieli A, Sterkin A, Grinvald A, Aertsen A. Dynamics of ongoing activity: explanation of the large variability in evoked cortical responses. Science. 1996;273:1868–1871. - PubMed
    1. Azouz R, Gray CM. Cellular mechanisms contributing to response variability of cortical neurons in vivo. J Neurosci. 1999;19:2209–2223. - PMC - PubMed
    1. Badre D, Doll BB, Long NM, Frank MJ. Rostrolateral prefrontal cortex and individual differences in uncertainty-driven exploration. Neuron. 2012;73:595–607. - PMC - PubMed
    1. Bandettini PA, Ungerleider LG. From neuron to BOLD: new connections. Nat Neurosci. 2001;4:864–866. - PubMed

Publication types

LinkOut - more resources