. 2013 Mar 13;33(11):4768-81.
doi: 10.1523/JNEUROSCI.5555-12.2013.

Rapid, activity-independent turnover of vesicular transmitter content at a mixed glycine/GABA synapse

Affiliations

Rapid, activity-independent turnover of vesicular transmitter content at a mixed glycine/GABA synapse

Pierre F Apostolides et al. J Neurosci. .

Abstract

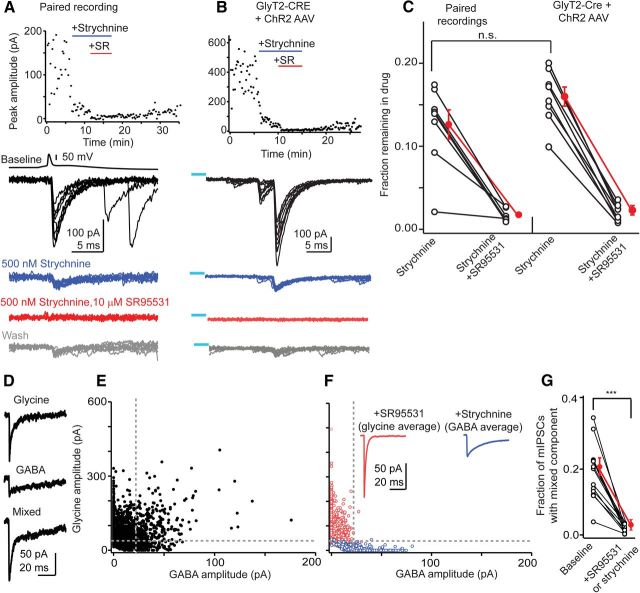
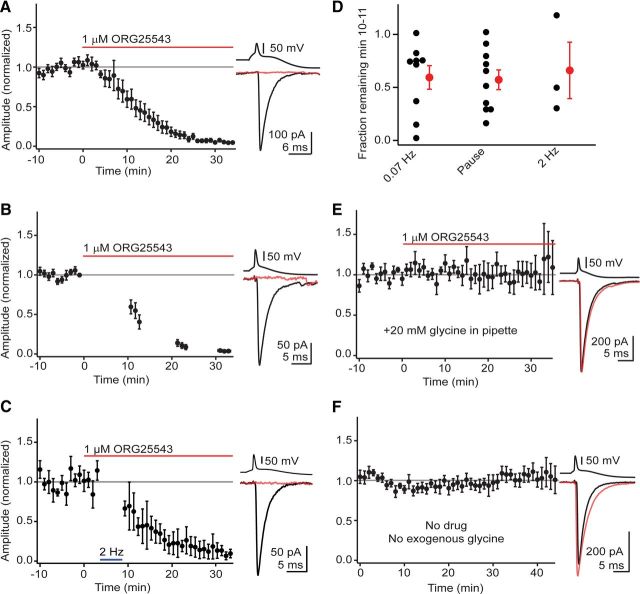
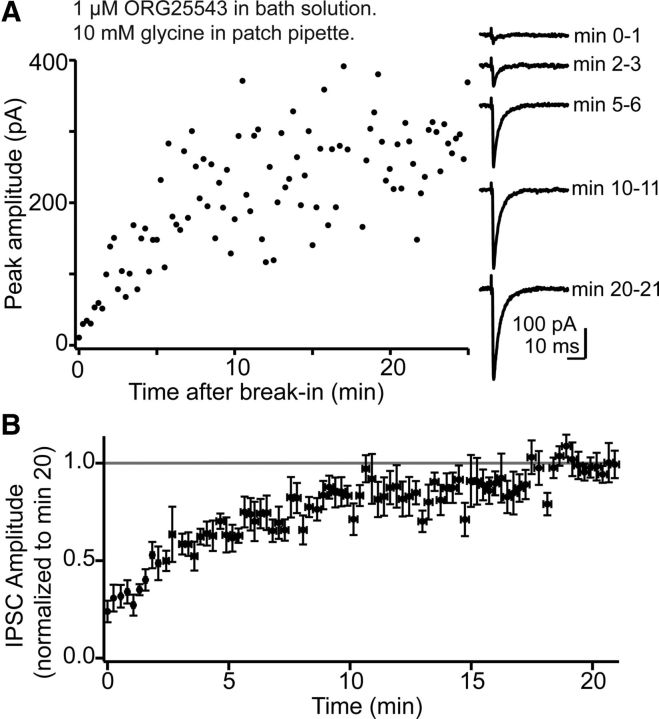
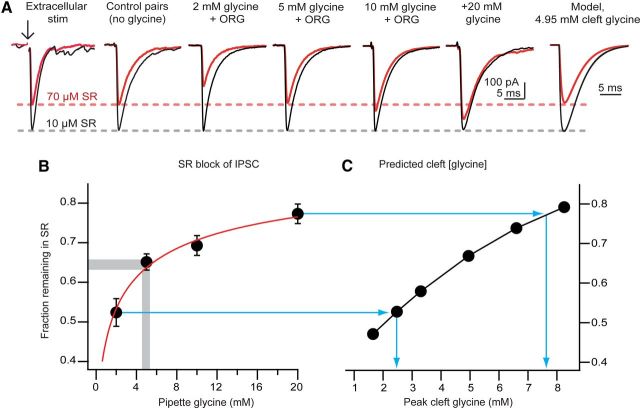
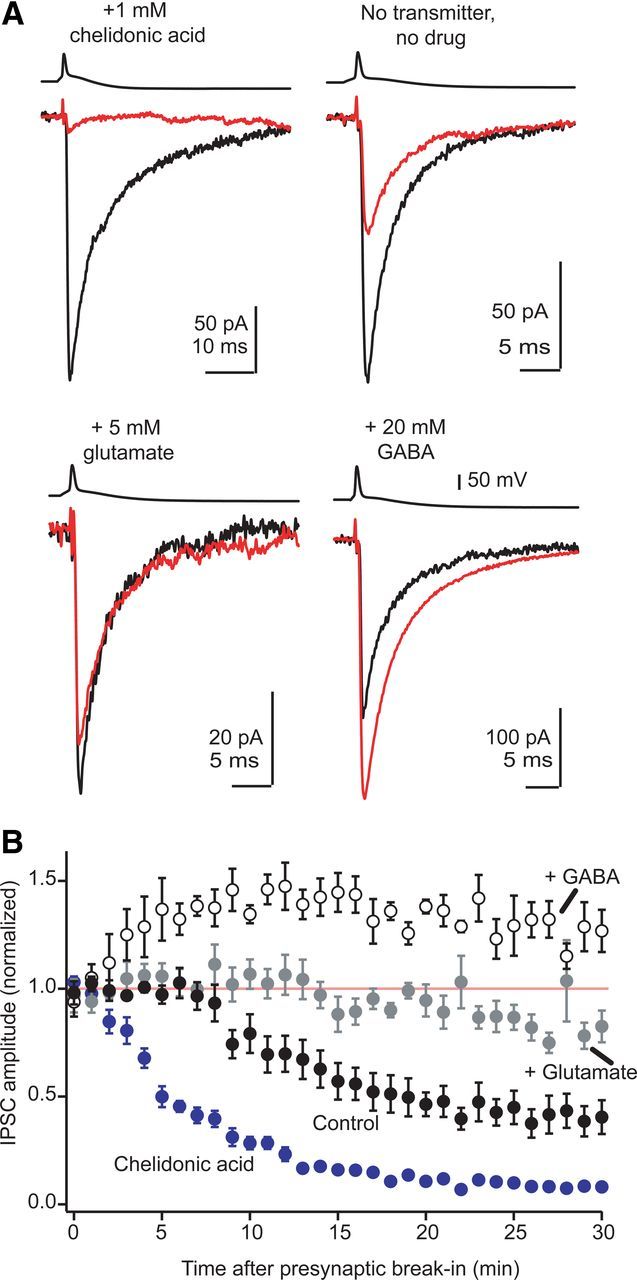
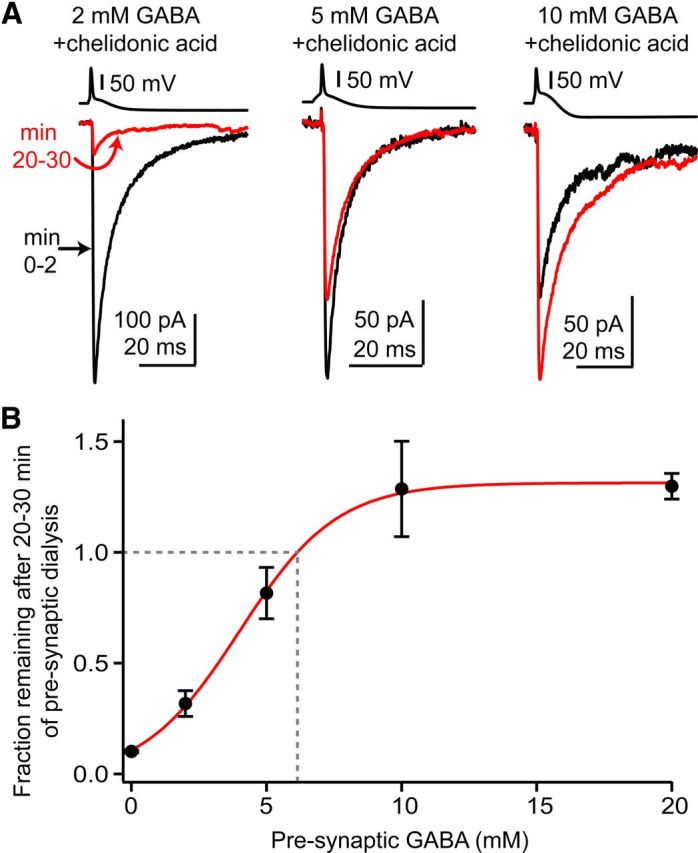
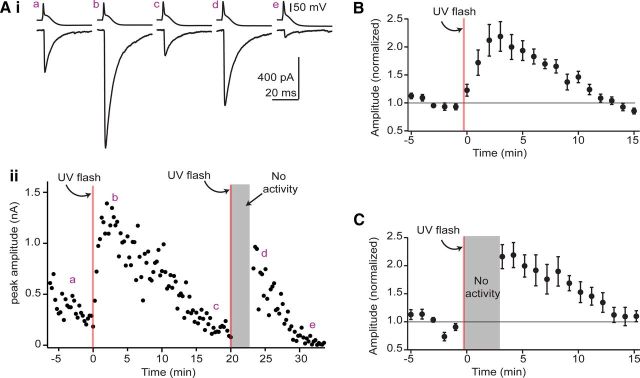
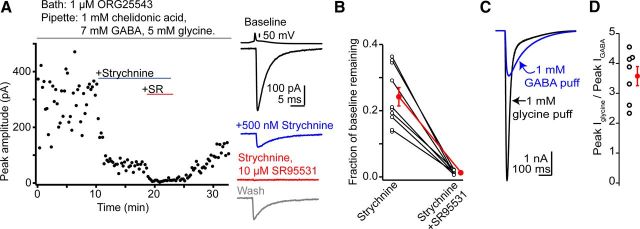
The release of neurotransmitter via the fusion of transmitter-filled, presynaptic vesicles is the primary means by which neurons relay information. However, little is known regarding the molecular mechanisms that supply neurotransmitter destined for vesicle filling, the endogenous transmitter concentrations inside presynaptic nerve terminals, or the dynamics of vesicle refilling after exocytosis. We addressed these issues by recording from synaptically coupled pairs of glycine/GABA coreleasing interneurons (cartwheel cells) of the mouse dorsal cochlear nucleus. We find that the plasma membrane transporter GlyT2 and the intracellular enzyme glutamate decarboxylase supply the majority of glycine and GABA, respectively. Pharmacological block of GlyT2 or glutamate decarboxylase led to rapid and complete rundown of transmission, whereas increasing GABA synthesis via intracellular glutamate uncaging dramatically potentiated GABA release within 1 min. These effects were surprisingly independent of exocytosis, indicating that prefilled vesicles re-equilibrated upon acute changes in cytosolic transmitter. Titration of cytosolic transmitter with postsynaptic responses indicated that endogenous, nonvesicular glycine/GABA levels in nerve terminals are 5-7 mm, and that vesicular transport mechanisms are not saturated under basal conditions. Thus, cytosolic transmitter levels dynamically set the strength of inhibitory synapses in a release-independent manner.


Figures

Figure 1.
Figure 1.
Transmission between cartwheel cells is predominantly glycinergic. A, Example paired recording between synaptically connected cartwheel cells demonstrating that glycine is the main neurotransmitter at this synapse. Top, IPSC amplitude over time from a single experiment, showing IPSC block by the glycine receptor antagonist strychnine and the GABAA receptor antagonist SR95531. Bottom, Traces from this experiment, with a single presynaptic action potential and an overlay of 10 IPSCs evoked during baseline conditions (black), in the presence of 500 nm strychnine (blue), and in the presence of strychnine + 10 μm SR95531. Bottom gray traces show partial recovery of IPSCs during drug washout. B, Optogenetic activation of cartwheel cells. In a GlyT2-cre mouse injected with a ChR2 AAV virus, wide-field blue light flashes evoked bursts of IPSCs that were mostly blocked by strychnine, similar to paired recordings. Top, Time course of the experiment. Bottom, Example of sweeps evoked in different drug conditions. The color scheme is the same as in A. Blue line denotes approximate offset of a 20 ms light stimulus in this experiment. C, Summary data plotting the IPSC amplitude remaining in strychnine and SR95531 from paired recordings and optogenetic experiments. The percentage block by strychnine was not significantly different between the two datasets, showing that transmission between cartwheel cells is mainly glycinergic. Open circles are individual experiments. Red points are mean ± SEM. D, Individual mIPSCs recorded in the absence of inhibitory blockers and in the presence of pentobarbital + zolpidem (to prolong the decay of the GABAA component) display a spectrum of decay kinetics and can be classified into three basic categories: rapidly decaying and predominantly glycinergic events, slowly decaying events mediated by GABAA receptors, and a third population with both fast glycinergic and slow GABAergic decay components. E, The relative amplitude of the glycinergic and GABAergic components of mIPSCs was measured by force fitting the decay phase of individual events recorded in absence of inhibitory blockers with a double exponential function containing the average glycine and GABAA decay time constants recorded in the presence of SR95531 or strychnine (Jonas et al., 1998; Awatramani et al., 2005). The amplitude of the slow GABAA decay is plotted on the x-axis whereas the fast glycine component is plotted on the y-axis. The dashed gray lines represent the 2× SD for the amplitudes of glycine and GABAA decay components, and events falling above the cutoff for both glycine and GABAA amplitudes were classified as coreleasing glycine/GABA. On average, 19.3 ± 2.2% of events recorded in absence of inhibitory blockers were classified as mixed glycine/GABA mIPSCs (n = 14 cells). Data are from two separate cells. F, mIPSCs recorded from the same two cells as E, but after the addition of strychnine (blue points) or SR95531 (red points) in one or the other cell. The majority of mIPSCs fell below the 2× SD lines after blocking either GABAA or glycine receptors with SR95531 or strychnine. Inset shows the average glycinergic and GABAergic mIPSC recorded in SR95531 or strychnine, respectively. Note the similarity in kinetics to the pure glycine and GABA events recorded (D). G, Summary data from 14 experiments similar to D–F. Red points are mean ± SEM. ***p = 0.00001, paired t test.
Figure 2.
Figure 2.
GlyT2 supplies the majority of glycine destined for filling of recycling vesicles. A–C, Bath application of the GlyT2 inhibitor ORG25543 causes a rapid and near complete rundown of glycinergic transmission independently of presynaptic activity. Left, Time course of rundown. Each data point is normalized mean ± SEM 3–9 individual experiments in A, 8–10 experiments in B, and 2–3 experiments in C. Right, Average of IPSCs from a single experiment evoked during baseline period (black) and after 25–30 min in ORG25543 (red trace). A, IPSCs were elicited at 0.07 Hz for the entirety of the experiment. B, Activity was suspended for the majority of drug application and transmission was periodically tested at ∼10 min intervals. The rundown in these “minimal activity” experiments was similar to the experiments in A. C, Presynaptic stimulation frequency was transiently increased from 0.07 to 2 Hz, eliciting between 572 and 600 action potentials during minute 3–8 of ORG25543 application. Upon returning to 0.07 Hz stimulation, IPSC rundown was not greater than in experiments from A and B. D, Summary showing the fraction remaining minutes 10–11 in experiments from A–C. No significant differences were found between the three conditions, demonstrating that presynaptic vesicle content equilibrates with cytosolic transmitter availability independently of exocytosis. Black dots represent values from individual experiments. Red is mean ± SEM. E, Adding exogenous glycine to the whole-cell internal solution occluded the rundown caused by GlyT2 block, showing that the ORG25543 effect was specifically due to loss of glycine availability in the presynaptic terminal. Right, Average IPSCs during baseline (black) and after 25–30 min in ORG25543 (red). Each time point is the normalized mean ± SEM from 4 to 6 individual experiments. F, Glycinergic transmission remains stable during whole-cell recordings with a glycine-free internal solution, showing that endogenous GlyT2 activity is sufficient to continuously fill synaptic vesicles even during prolonged dialysis. Right, Average IPSCs during minute 0–3 (black) and minute 35–40 (red). Each time point is the normalized mean ± SEM from 3 to 7 individual experiments.
Figure 3.
Figure 3.
Rapid restoration of transmission in glycine-depleted cartwheel cells. A, Data from a single experiment where the slice was pre-incubated in 1 μm ORG25543 for ∼ 2 h. Glycinergic transmission was isolated with 10 μm SR95531. A pair of cartwheel cells was patched with an internal solution containing 10 mm glycine. Data collection at t = 0 began <1 min after breaking into the presynaptic cell. IPSC amplitudes rapidly increased during the first 20 min after break-in. Right, Example IPSCs (average of 4 sweeps per trace) at various times during presynaptic glycine dialysis. B, Average time course of transmission run up by presynaptic dialysis of 10 mm glycine in ORG25543-treated slices, similar to the experiment in A. T = 0 begins <2 min after presynaptic break-in. Data are normalized to the average IPSC amplitude at t = 20 min, and each data point is the normalized mean ± SEM 6–8 individual experiments.
Figure 4.
Figure 4.
GlyT2 supplies ∼ 5 mm to presynaptic terminals. A, Cytosolic transmitter concentrations determine the degree of vesicle filling. Example average IPSCs evoked during baseline (10 μm SR95531) and after partial block of glycine receptors with 70 μm SR95531 (red traces) under endogenous conditions (control pairs and extracellular stimulation) and in paired recordings with experimentally determined concentrations of exogenous glycine. Far right trace shows results of a kinetic model for 4.95 mm peak cleft glycine and the relative amplitudes predicted for 10 and 70 μm SR95531. B, Summary plotting the fraction IPSC remaining in 70 μm SR95531 as a function of presynaptic glycine concentration. These values were fit with a Hill equation of the form Baseline + Ymax × (CC+EC50)n, with C as concentration, and fit parameters of Baseline (starting amplitude), EC50 (half-maximal concentration), n (slope parameter), and Ymax (peak response). The fitted parameters for the red line were 0.12, 1.76 mm, 0.63, and 0.91, respectively. Gray bar brackets range of block seen with control pairs or extracellular stimulation, predicting ∼5 mm cytosolic glycine. C, A kinetic model (Beato, 2008) was driven with different peak glycine transients and the relative block in 70 μm versus 10 μm was compared, as in B. Blue lines connect experimental values in B for the range of cytosolic glycine levels used to the corresponding predicted values of cleft glycine in the model.
Figure 5.
Figure 5.
GAD supplies the majority of GABA for synaptic vesicles. A, Average of GABAA IPSCs evoked during the first 2 min after breaking into the presynaptic cell (black traces) and after 25–30 min of presynaptic dialysis (red traces). Each pair of red and black traces is from the same individual experiment. Dialyzing presynaptic cells with 1 mm chelidonic acid caused a near complete rundown of GABAergic transmission. Prolonged dialysis with a control internal solution caused partial rundown of GABAergic transmission that was reduced by exogenous glutamate, while 20 mm GABA potentiated transmission. B, Average time course of experiments shown in A. Each data point is the normalized mean ± SEM of 5–9 individual experiments in each condition.
Figure 6.
Figure 6.
GAD supplies millimolar concentrations of GABA. A, Average GABAA IPSCs in single experiments during presynaptic dialysis with chelidonic acid and different concentrations of exogenous GABA. The black trace is an average of IPSCs during the first 2 min after presynaptic break-in and the red trace is an average of minute 20–30. The large hyperpolarization following the presynaptic action potential is due to negative current injection to prevent complex spike firing. B, Fractional IPSC remaining after 20–30 min is plotted against the concentration of exogenous GABA added to the presynaptic pipette solution. Data are normalized to the amplitude of IPSCs recorded during the first 2 min after presynaptic dialysis. The point 0 represents dialysis with chelidonic acid and 0 mm GABA. The 20 mm GABA data are from experiments in Figure 5 where presynaptic cells were loaded with 20 mm GABA and no chelidonic acid. To estimate the GABA concentration needed to prevent rundown (dashed gray line), the data were fit with a sigmoidal function of the form Baseline + {YMAX/(1 + exp((EC50C)/n))}, with C as concentration; the fitted parameters were Baseline (starting level of the fit), YMAX (peak), EC50 (concentration at half maximal run-down), and n (slope factor). For the solid red line these parameters were 0.02, 1.34, 4.01 mm, and 1.8. This equation was also used for jackknife analysis of the dataset as described in the text.
Figure 7.
Figure 7.
Vesicles re-equilibrate with cytosolic transmitter within 1 min and independently of activity. A, Time course of GABAA IPSC amplitudes (bottom) and average traces at different time points (top) from a recording with 5 mm MNI-caged glutamate added to the presynaptic internal solution. Presynaptic whole-cell recording began ∼10 min before data collection. Uncaging glutamate by wide-field UV flash (500 ms; red line) rapidly potentiated GABAergic transmission. At the ∼20 min mark, presynaptic activity was suspended and glutamate was uncaged a second time. Presynaptic activity resumed 3 min after uncaging, and IPSC amplitudes were similarly potentiated. B–C, Average time course of the uncaging effect in experiments where IPSCs were continuously evoked after uncaging (B) or in experiments where presynaptic activity was suspended during uncaging (C). Each data point is the normalized mean ± SEM of 11–12 individual experiments (B) or 6–9 experiments (C).
Figure 8.
Figure 8.
Postsynaptic receptor density determines IPSC phenotype. A, Presynaptic cartwheel cells loaded with 5 mm glycine + 7 mm GABA recapitulate the endogenous, predominantly glycinergic IPSC phenotype. Slices were pre-incubated in ORG25543 and cartwheel cells were patched with an internal solution containing 5 mm glycine, 7 mm GABA, and 1 mm chelidonic acid. Left, Time course from a single experiment plotting IPSC amplitude over time, showing that IPSCs evoked under these conditions are predominantly blocked by the glycine receptor antagonist strychnine. Right, Traces show a single presynaptic action potential and average IPSCs from this experiment during the baseline period (black, no inhibitory blockers), in strychnine (blue), and in strychnine + SR95531 (red). Gray trace is partial recovery during drug washout. B, Summary data plotting the fractional IPSC remaining in the presence of strychnine and strychnine + SR95531. Open circles are individual experiments. Red circles denote mean ± SEM. Data are normalized to the average IPSC amplitude during baseline. C, Puff application (10 ms, 5 psi) of 1 mm glycine or GABA to the same cell reveals that postsynaptic glycine currents are ∼3-fold larger than GABAA currents. Traces are averages from a single experiment. D, Summary of puff-evoked glycine/GABAA current ratios in seven cells similar to C. Open circles are individual experiments. Red dot represents mean ± SEM of these data.

References

    1. Agoston DV, Kosh JW, Lisziewicz J, Whittaker VP. Separation of recycling and reserve synaptic vesicles from cholinergic nerve terminals of the myenteric plexus of guinea pig ileum. J Neurochem. 1985;44:299–305. - PubMed
    1. Awatramani GB, Turecek R, Trussell LO. Staggered development of GABAergic and glycinergic transmission in the MNTB. J Neurophysiol. 2005;93:819–828. - PubMed
    1. Axmacher N, Stemmler M, Engel D, Draguhn A, Ritz R. Transmitter metabolism as a mechanism of synaptic plasticity: a modeling study. J Neurophysiol. 2004;91:25–39. - PubMed
    1. Bagley EE, Hacker J, Chefer VI, Mallet C, McNally GP, Chieng BC, Perroud J, Shippenberg TS, Christie MJ. Drug-induced GABA transporter currents enhance GABA release to induce opioid withdrawal behaviors. Nat Neurosci. 2011;14:1548–1554. - PubMed
    1. Beato M. The time course of transmitter at glycinergic synapses onto motoneurons. J Neurosci. 2008;28:7412–7425. - PMC - PubMed

Publication types

MeSH terms