. 2013 Mar 13;33(11):4935-46.
doi: 10.1523/JNEUROSCI.4930-12.2013.

Electrophysiological characterization of spino-sciatic and cortico-sciatic associative plasticity: modulation by trans-spinal direct current and effects on recovery after spinal cord injury in mice

Affiliations

Electrophysiological characterization of spino-sciatic and cortico-sciatic associative plasticity: modulation by trans-spinal direct current and effects on recovery after spinal cord injury in mice

Zaghloul Ahmed. J Neurosci. .

Abstract

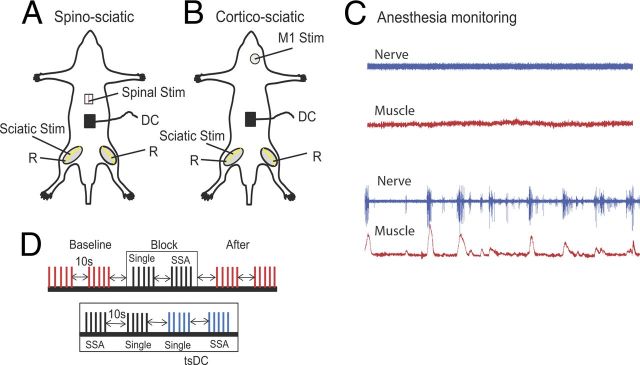
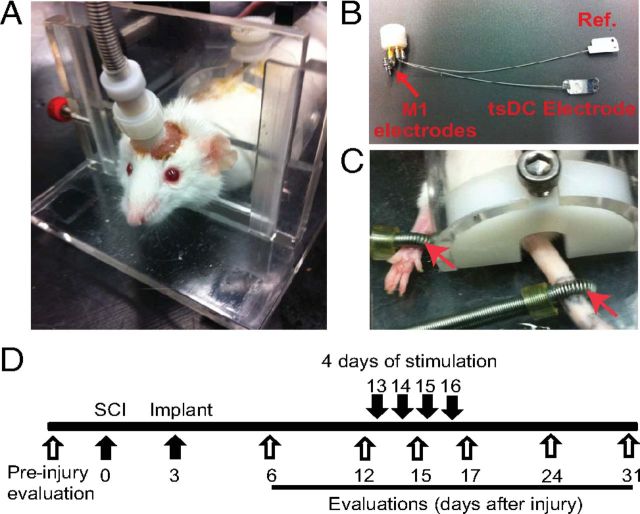
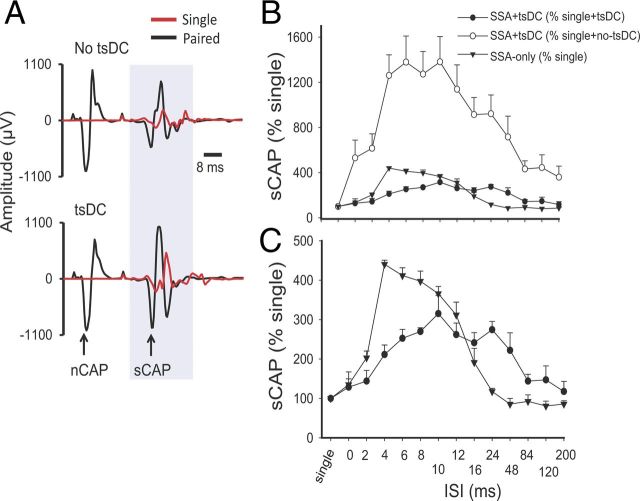
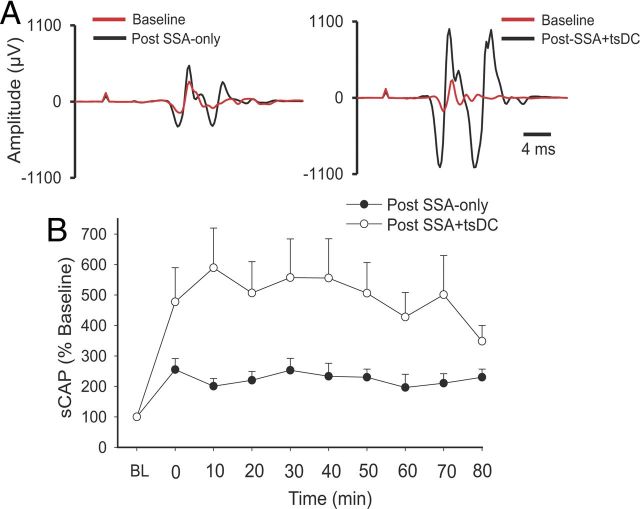
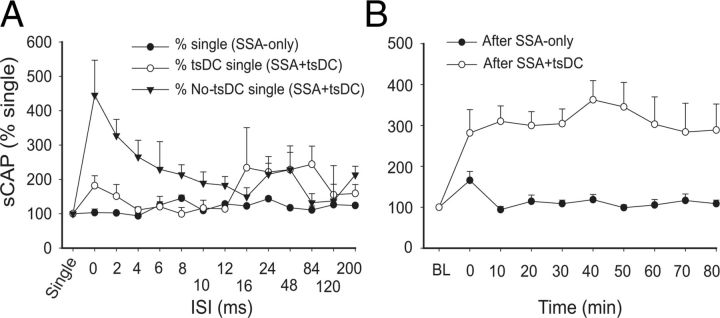
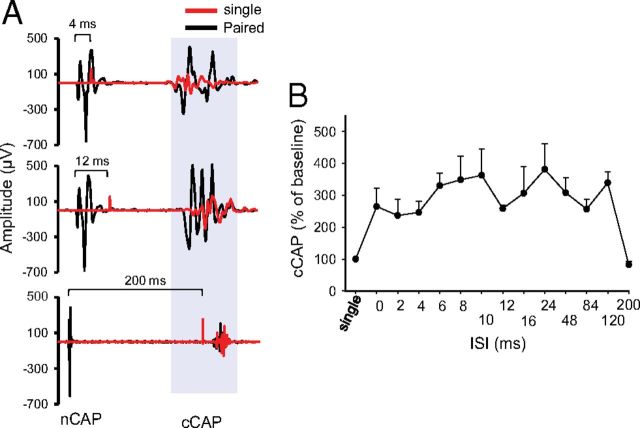
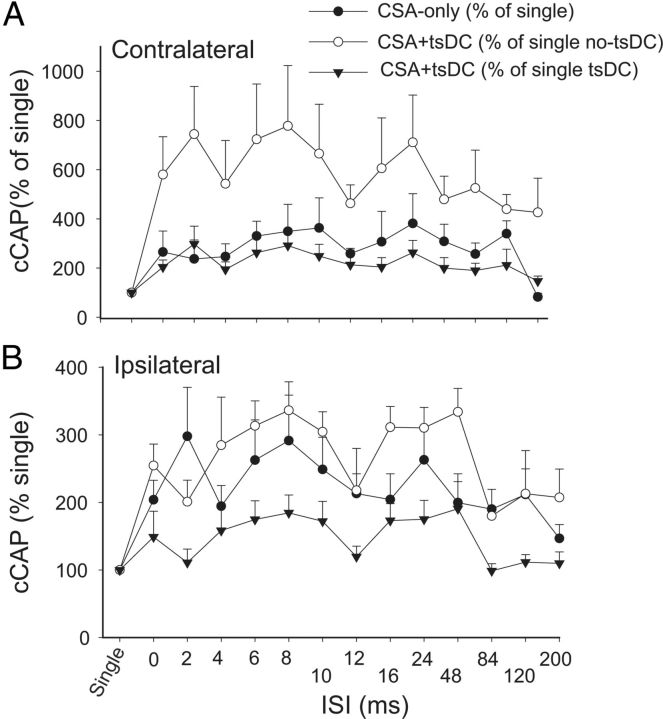
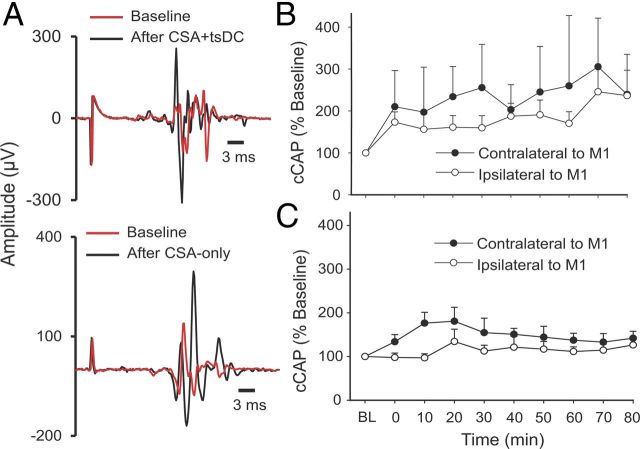
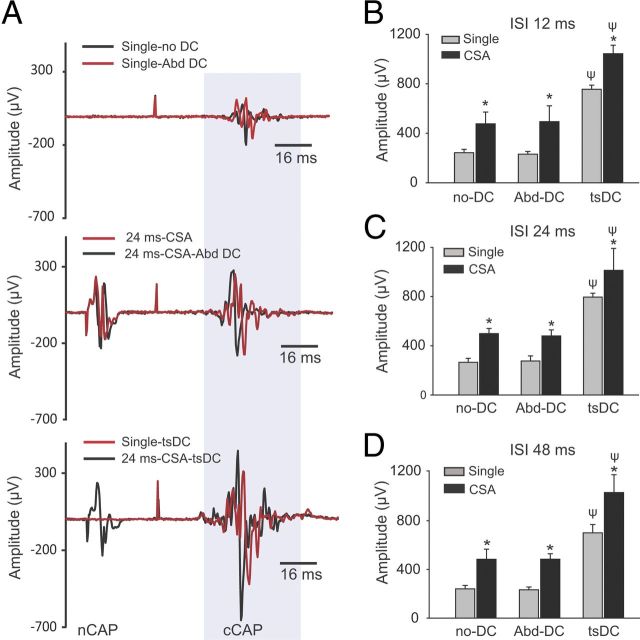
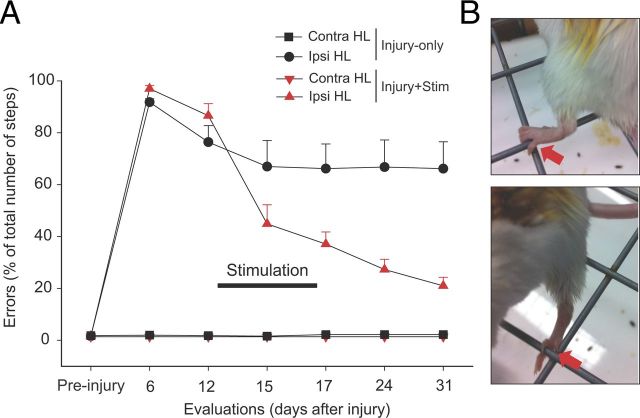
Associative stimulation causes enduring changes in the nervous system based on the Hebbian concept of spike-timing-dependent plasticity. The present study aimed to characterize the immediate and long-term electrophysiological effects of associative stimulation at the level of spinal cord and to test how trans-spinal direct current stimulation (tsDC) modulates associative plasticity. The effect of combined associative stimulation and tsDC on locomotor recovery was tested in a unilateral model of spinal cord injury (SCI). Two associative protocols were tested: (1) spino-sciatic associative (SSA) protocol, in which the first stimulus originated from the sciatic nerve and the second from the spinal cord; and (2) cortico-sciatic associative (CSA) protocol, in which the first stimulus originated from the sciatic nerve and the second from the motor cortex. In addition, those two protocols were repeated in combination with cathodal tsDC application. SSA and CSA stimulation produced immediate enhancement of spinal and cortical outputs, respectively, depending on the duration of the interstimulus interval. Repetitive SSA or CSA stimulation produced long-term potentiation of spinal and cortical outputs, respectively. Applying tsDC during SSA or CSA stimulation markedly enhanced their immediate and long-term effects. In behaving mice with unilateral SCI, four consecutive 20 min sessions of CSA + tsDC markedly reduced error rate in a horizontal ladder-walking test. Thus, this form of artificially enhanced associative connection can be translated into a form of motor relearning that does not depend on practice or experience.


Figures

Figure 1.
Figure 1.
Schematic diagram of the acute experimental setup illustrating two stimulation arrangements. A, SSA stimulation setup, in which spinal cord level L1 was stimulated at the dorsal column (bipolar needle electrode). B, CSA stimulation setup, in which the M1 area of the crural muscles was stimulated. In both arrangements, the sciatic nerve was stimulated on one side, usually the left. Evoked potentials were recorded from both sciatic nerves (R, recording). DC was applied over the lumbar spine. C, Level of anesthesia was monitored by observing the spontaneous activity of nerve (blue) and muscle (red). The top shows the desired level at which all recording and stimulation is performed; the bottom shows a level when anesthesia was starting to wear off. D, Schematic illustration showing part of the ISI stimulation protocol. The protocol consisted of baseline (trains of 5 shocks at 0.5 Hz, repeated every 10 s), a block of SSA-only (train of 5 single shocks at 0.5 Hz, 10 s break, train of 5 SSA at 0.5 Hz), and posttest stimulation identical to baseline. Bottom shows a block of SSA + tsDC, which consisted of a train of five single shocks with no tsDC, a train of five single shocks during tsDC, SSA with no tsDC, and SSA during tsDC. This paradigm was repeated to test all ISIs and to test CSA.
Figure 2.
Figure 2.
Lesion verification. A, Nissl staining of a longitudinal section of the dorsal aspect of the spinal cord at the level of the spinal canal and at ventral aspects. Red arrows indicate the injury site. B, A transverse section of the spinal cord constructed from the longitudinal slices. Numbers correspond to the photographs shown in A. Note that the lower part of the spinal cord on the injury side, which mainly contains spinothalamic tracts, was not damaged by the injury. This injury was similar in all animals.
Figure 3.
Figure 3.
Chronic experiment setup and protocol. All mice were subjected to left unilateral SCI (hemisection). A, The mouse was placed in a restraining box, and the pedestal was attached to a cable that is connected to stimulators. B, Spinal electrodes were connected to the pedestal by multiple stranded wires (nylon insulated). The tsDC electrode was placed over the spinal column, and the reference electrode (Ref.) was placed subcutaneously on the lateral side of the abdomen. One side of these electrodes was painted with electrically insulating material. Cortical (M1) electrodes were made of two self-tapping bone screws (shaft diameter, 0.85 mm; length, 4 mm; 2.5 mm apart) that were inserted into the skull bone covering the right hindlimb cortical areas. Relative to bregma, the anodal electrode was placed −0.5 mm posterior and 1 mm lateral (on the right side), and the cathodal electrode was approximately −3 mm posterior and 0.5 mm lateral. Screws were not allowed to penetrate through the skull bone. The pedestal and screws were attached to the skull using dental cement. C, Peripheral stimulations were applied using ring electrodes (red arrows) that were fastened around the paw (positive) and base of the tail (reference). D, Experimental time line. Behavioral evaluations were done before SCI. The spinal cord was hemisectioned on day 0, and the stimulation system was implanted on day 3. After implantation, behavioral evaluations were performed on days 6, 12, 15, 17, 24, and 31. Stimulation was applied on days 13, 14, 15, and 16.
Figure 4.
Figure 4.
Spinal excitability enhancement by SSA stimulation or SSA + tsDC. A, Top shows examples of sCAP and nCAP. The red trace is an sCAP evoked by single pulse, and the black trace shows two responses, the first in response to nCAP and the second in response to spinal stimulation. No tsDC was applied during this recording. Bottom shows examples of sCAP and nCAP during tsDC (−0.8 mA). Spinal stimulus intensity was the same during single, paired, no-tsDC, and tsDC conditions, and nerve stimulus intensity was the same during no-tsDC and tsDC conditions. B, Summary plot showing percentage change in sCAP during SSA and SSA + tsDC. sCAP evoked during SSA protocol were expressed as percentage of baseline sCAP evoked by single-pulse stimulation. sCAP evoked during SSA + tsDC were expressed both as a percentage of single-pulse during no-tsDC and as a percentage of single-pulse during tsDC. C, The data for SSA + tsDC and SSA-only from B are shown to clearly illustrate the difference between the two groups.
Figure 5.
Figure 5.
Long-term enhancement of sCAP after SSA-only and SSA + tsDC ipsilateral to the stimulated nerve. SSA (12 ms ISI) was repeated 90 times at 1 Hz. A, Left shows traces of sCAP evoked at baseline (red) and after SSA (black). Right shows traces of sCAP evoked at baseline (red) and after SSA + tsDC (black). B, Summary plot showing the time course of the changes in sCAP expressed as percentage of baseline (BL).
Figure 6.
Figure 6.
Changes in the sCAP contralateral to the stimulated nerve. A, Effects of conditioning stimulus. sCAP evoked during SSA-only was expressed as a percentage of the single-pulse response. sCAP evoked during SSA + tsDC was expressed as a percentage of the single-pulse response during tsDC and no-tsDC conditions. B, Time course of SSA + tsDC mediated long-term enhancement contralateral to the stimulated nerve. Whereas SSA-only-mediated enhancement faded almost immediately after the end of the protocol, SSA + tsDC-mediated enhancement persisted for at least 80 min after stimulation [baseline (BL)].
Figure 7.
Figure 7.
CSA stimulation enhanced contralateral cortical output. A, Sample traces of cCAP. Top shows single-pulse-induced cCAP (red) overlapped over CSA-induced trace (black) at 4 ms ISI. In all CSA traces, the first potential is the nCAP and the second is cCAP. The middle trace shows an overlay of single-pulse-induced cCAP (red) and 12 ms ISI CSA trace (black). The bottom shows overlay of single-pulse-induced cCAP (red) and 200 ms interstimulus CSA trace (black). B, Summary plot showing an increase in cCAP during various ISIs expressed as percentage of single-pulse-induced cCAP.
Figure 8.
Figure 8.
CSA stimulation only or combined with tsDC enhanced contralateral and ipsilateral responses. The M1 was stimulated epicranially, and nCAP was recorded bilaterally. CSA was tested at various ISIs. A, Responses contralateral to M1. cCAP are expressed as a percentage of baseline single-pulse-induced CAP. CAP during CSA-only is expressed as a percentage of baseline single-pulse-induced CAP (percentage of single). CAP during CSA + tsDC is expressed as a percentage of single-pulse-induced CAP during tsDC (percentage of single tsDC) and during no tsDC (percentage of single no-tsDC). Overall, these results show significant effects of CSA and CSA + tsDC. Note that CSA-only values plotted in A are the same as in B to allow comparison. B, Responses ipsilateral to M1. All values are expressed as in A.
Figure 9.
Figure 9.
Long-term enhancement of cCAP. The CSA protocol to induce persistent changes was 90 pulses at 1 Hz and 12 ms ISI, applied with and without tsDC. A, Examples of cCAP. Top shows contralateral cCAP traces recorded at baseline (red) and after CSA + tsDC stimulation (black). Note that pretest and posttest stimuli have identical parameters. Bottom shows contralateral traces of cCAP recorded at baseline (red) and after CSA-only (black). B, Summary plot showing long-term contralateral and ipsilateral changes after the CSA + tsDC stimulation. C, Summary plot showing contralateral and ipsilateral changes after CSA-only. Data are expressed as percentage of baseline (BL).
Figure 10.
Figure 10.
The effect of tsDC is specific. CSA stimulation was performed during tsDC and Abd-DC. CSA was tested at ISIs of 12, 24, and 48 ms. Abd-DC was applied by a DC electrode placed on the abdominal muscles 1.5 cm lateral to the lumber spinal column (see Materials and Methods). Five animals were used in these experiments. A, Traces recorded under different conditions in the same animal. The top shows cCAP recorded under two conditions: without DC and during Abd-DC (−0.8 μA). The middle shows CSA (ISI of 24 ms) without DC (red) and during Abd-DC (black). The bottom shows responses to a single stimulation of M1 (red) and CSA during tsDC (−0.8 μA) (black). B, Summary plot showing that CSA at ISI of 12 ms was significantly increased by tsDC but not Abd-DC. C, Summary plot showing that CSA at ISI of 24 ms was significantly increased by tsDC but not Abd-DC. D, Summary plot showing that CSA at ISI of 48 ms was significantly increased by tsDC but not Abd-DC. Overall, these findings show that tsDC is specific in its effect on the spinal cord. *p < 0.001 relative to respective single potential; ψp < 0.001 relative to without tsDC.
Figure 11.
Figure 11.
Extracellular responses recorded from L4 level. Insets show the recording sites. A, M1 stimulation. At L4 spinal level, extracellular responses were recorded from dorsal corticospinal tract (dCST, left) and from ventral horn (right). Three volleys were recorded from dCST (see asterisks) with latencies of 1.25, 2.25, and 3.00 ms. Responses recorded from the ventral horn showed dCST volleys with a delayed response (11 ms). B, Sciatic nerve stimulation. At the L4 spinal level, extracellular recording showed two main responses (marked with asterisks), a fast first response with 0.8 ms latency and a delayed second response with 2.6 ms latency. C, Spinal cord stimulation. The spinal cord was stimulated at the level of L1, and recording was obtained from the L4 ventral horn, which showed an onset latency of 1 ms. Arrow marks the deflection caused by stimulus artifact. Asterisks mark the two spinal responses.
Figure 12.
Figure 12.
Synaptic activation was necessary for associative plasticity. Kynurenic acid (glutamatergic receptor antagonist) or CNQX (AMPA receptor antagonist) were injected into the L4 level of the spinal cord. Both molecules blocked the late components of either nCAP or sCAP. A, Vehicle control (no drug). Sciatic nerve stimulation (top) or spinal stimulation (bottom) induces a biphasic potential. B, The second wave (marked by asterisks in A) is synaptically mediated, because it disappeared after injection of kynurenic acid or CNQX (data not shown). C, An example of associative stimulation-induced potential overlaid with single-pulse-induced potential, showing that SSA stimulation is not effective in amplifying potentials in the presence of kynurenic acid. D, Summary plot showing that SSA stimulation was not effective at ISIs of 0, 4, 8, 12, and 16 ms.
Figure 13.
Figure 13.
Combined stimulation treatment improved skilled locomotor control. Mice were stimulated using an implanted system that delivers tsDC to the spinal cord and pulses to M1. Mice were stimulated 20 min/d for 4 consecutive days (days 13–16). A, Error rate was reduced significantly during and after the CSA + tsDC stimulation protocol. The graph summarizes data from two groups of animals: injury-only (black) and injury + CSA + tsDC (black). In both groups, the hindlimb contralateral to hemisection (Contra HL) injury showed no deficit. However, the ipsilateral hindlimb (Ipsi HL) was impaired during horizontal ladder walking, because mice committed >90% missteps, defined as any miss or slip off the rung. The injury-only group showed spontaneous partial recovery, indicated by a significant reduction in the number of errors 2 weeks after injury (see day 15). The group that received CSA + tsDC showed immediate and significant reduction in the number of missteps (see day 15), and they continued to improve to reach 24% errors on day 31. B, Photographs showing ipsilateral hindlimb use as mice walked on a grid. The top shows the animal gripping with the hindpaw, whereas the bottom shows the animal using an individual toe. These observations were not quantified but were seen only in animals that received the CSA + tsDC protocol.

References

    1. Aguilar J, Pulecchi F, Dilena R, Oliviero A, Priori A, Foffani G. Spinal direct current stimulation modulates the activity of gracile nucleus and primary somatosensory cortex in anesthetized rats. J Physiol. 2011;589:4981–4996. - PMC - PubMed
    1. Ahmed Z. Trans-spinal direct current stimulation modulates motor cortex-induced muscle contraction in mice. J Appl Physiol. 2011;110:1414–1424. - PubMed
    1. Ahmed Z, Wieraszko A. Trans-spinal direct current enhances corticospinal output and stimulation-evoked release of glutamate analog, d-2,3-(3)H-aspartic acid. J Appl Physiol. 2012;112:1576–1592. - PubMed
    1. Alstermark B, Ogawa J. In vivo recordings of bulbospinal excitation in adult mouse forelimb motoneurons. J Neurophysiol. 2004;92:1958–1962. - PubMed
    1. An S, Yang JW, Sun H, Kilb W, Luhmann HJ. Long-term potentiation in the neonatal rat barrel cortex in vivo. J Neurosci. 2012;32:9511–9516. - PMC - PubMed

MeSH terms

Substances