. 2013 May 1;126(Pt 9):2027-41.
doi: 10.1242/jcs.122234. Epub 2013 Mar 13.

Activation of conventional kinesin motors in clusters by Shaw voltage-gated K+ channels

Affiliations

Activation of conventional kinesin motors in clusters by Shaw voltage-gated K+ channels

Joshua Barry et al. J Cell Sci. .

Abstract

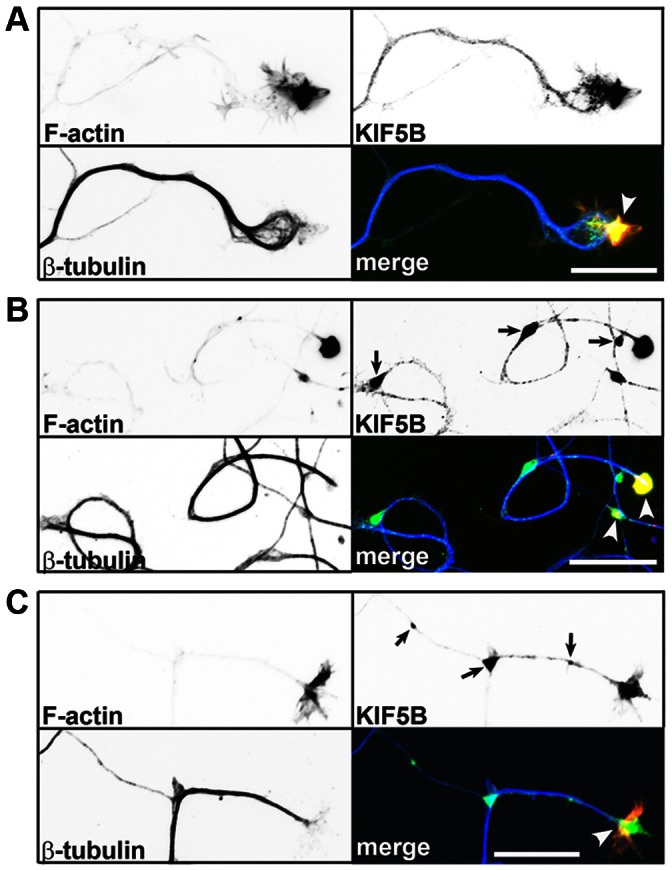
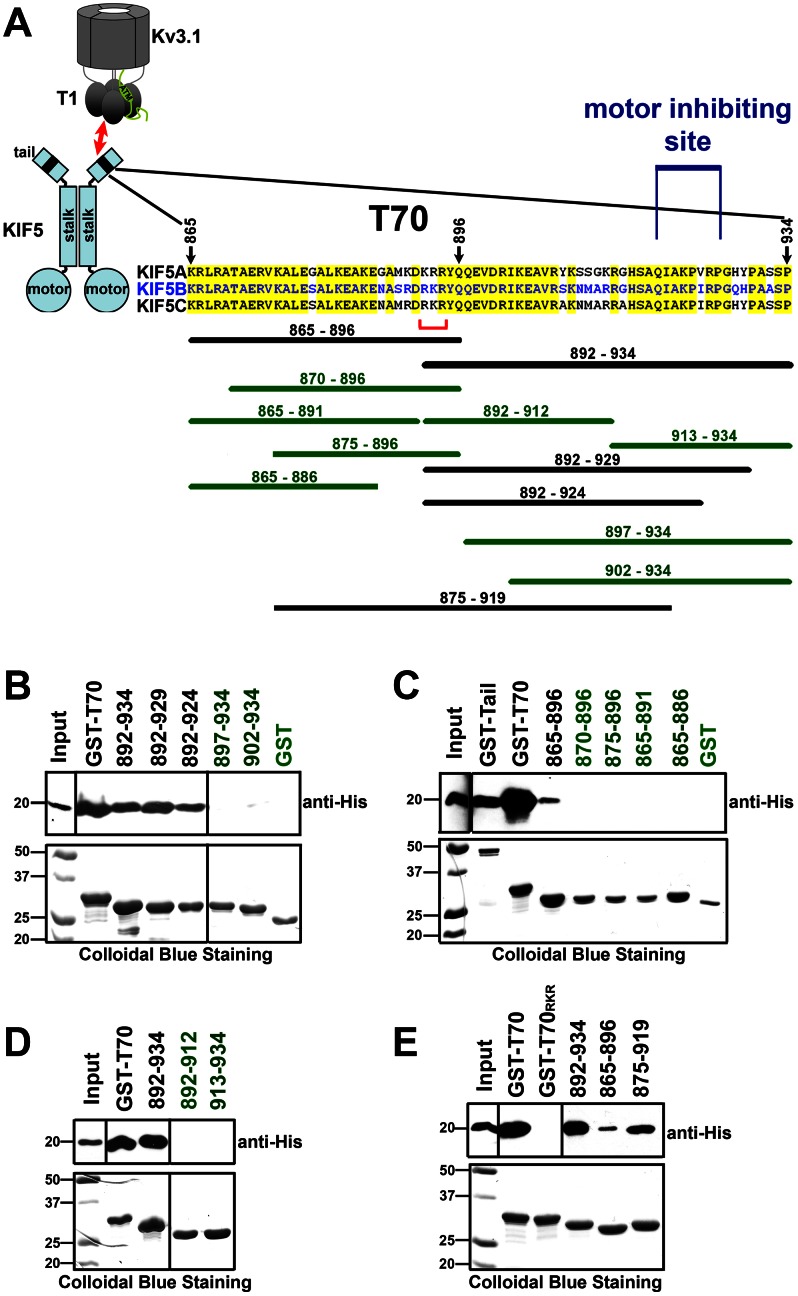
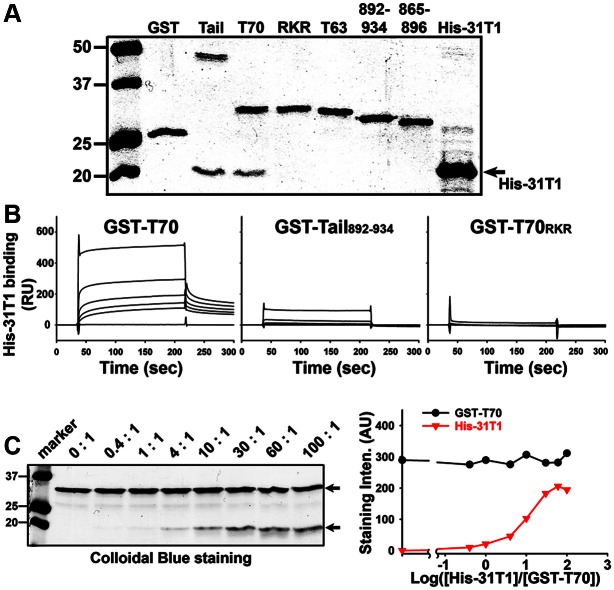
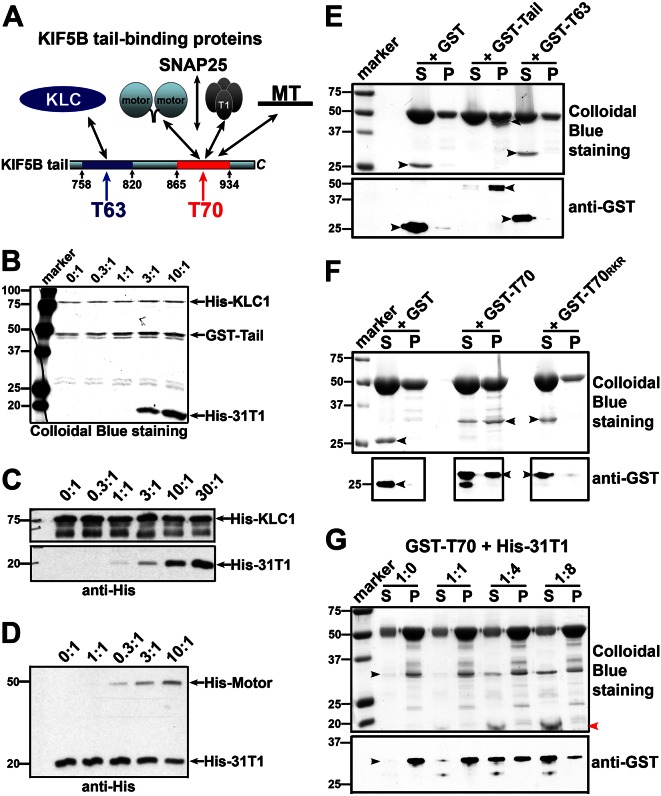
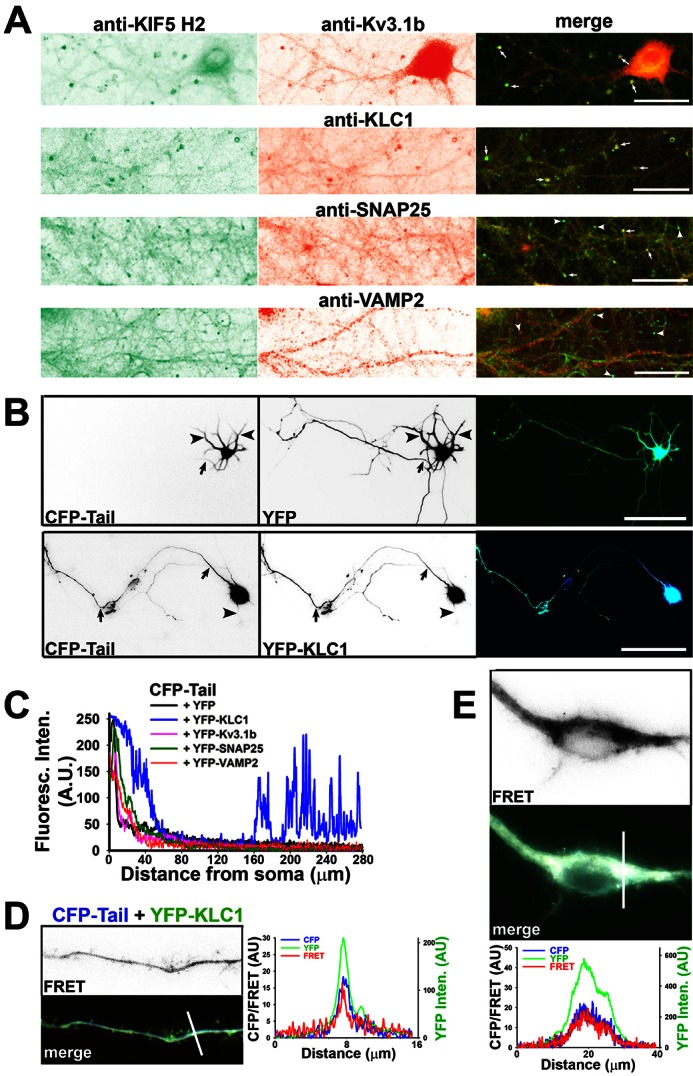
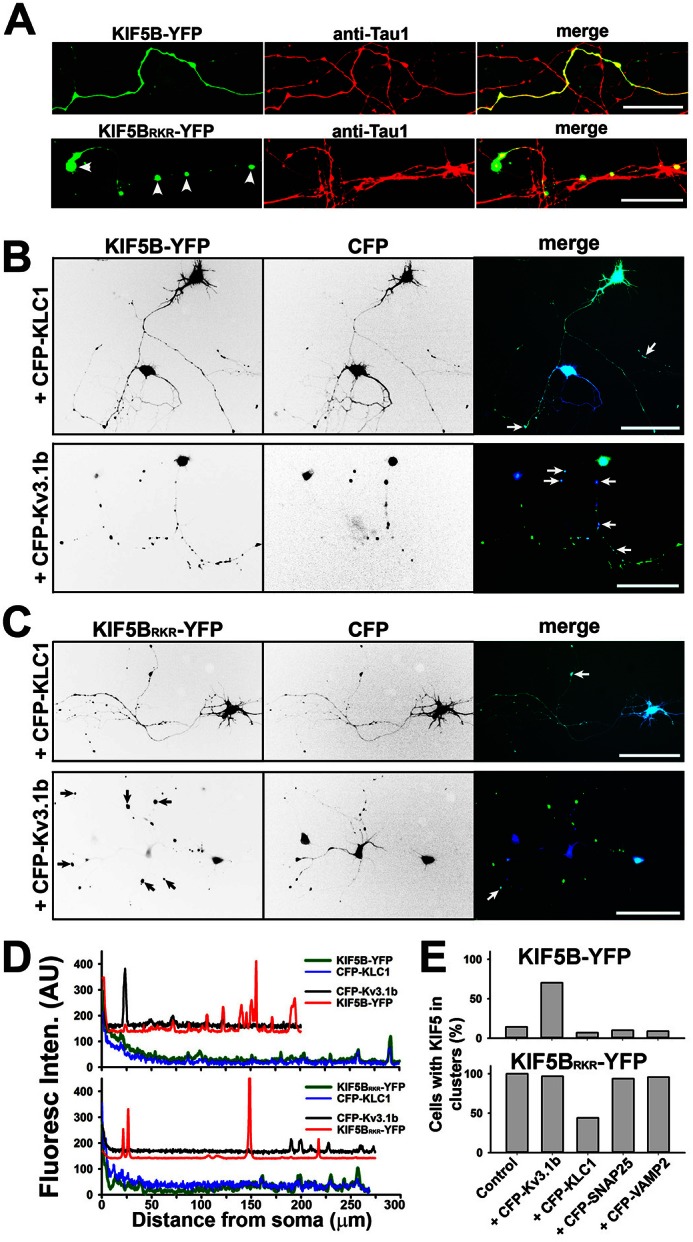
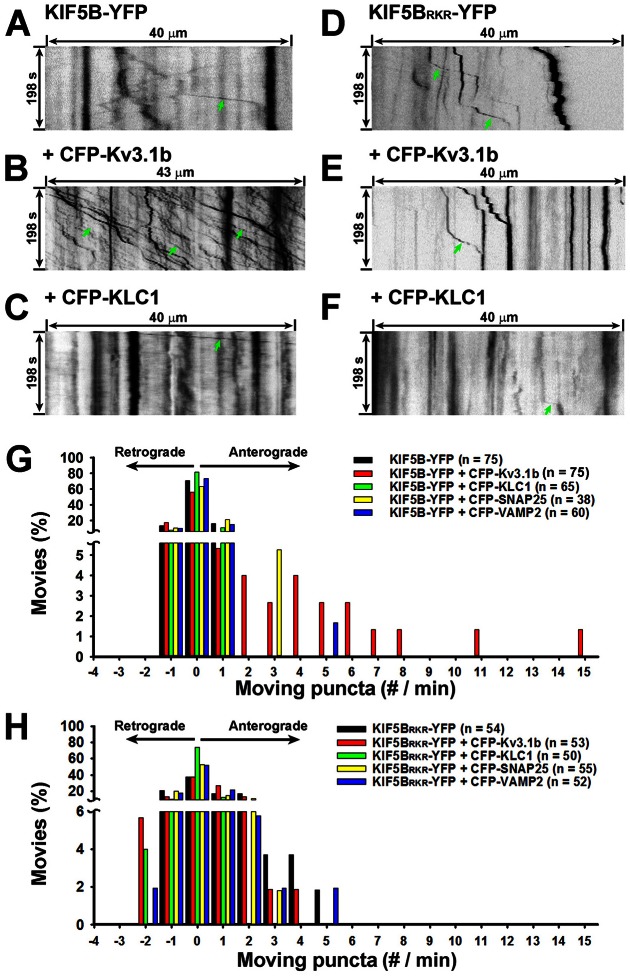
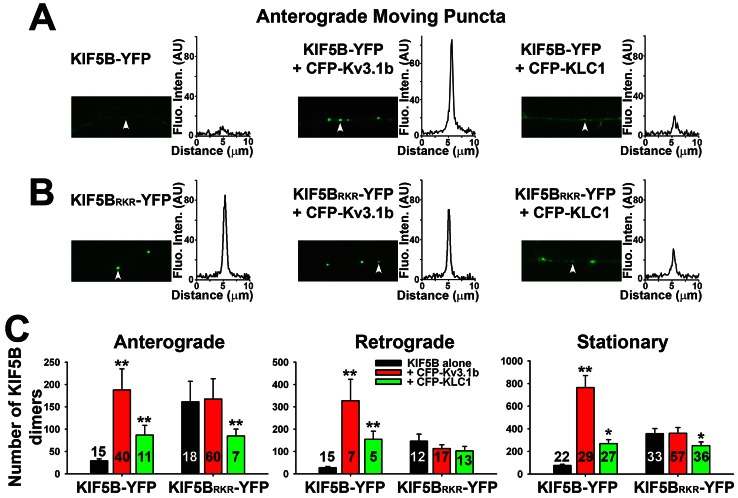
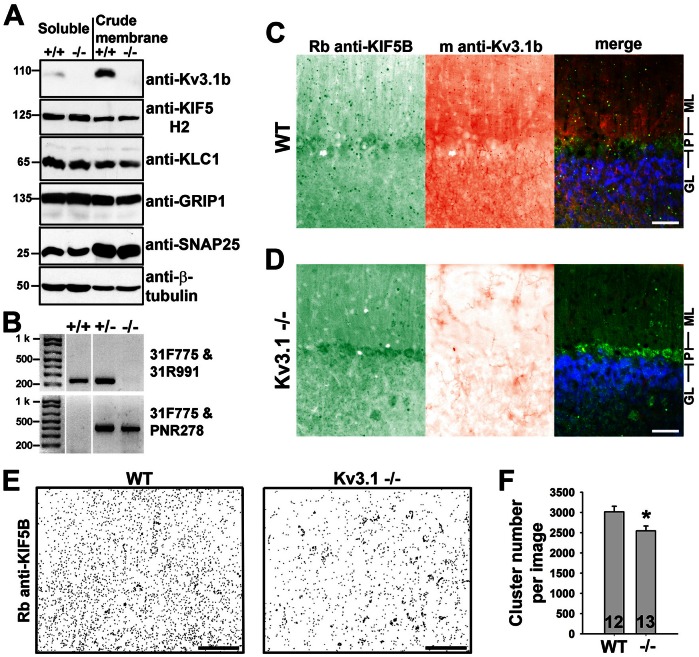
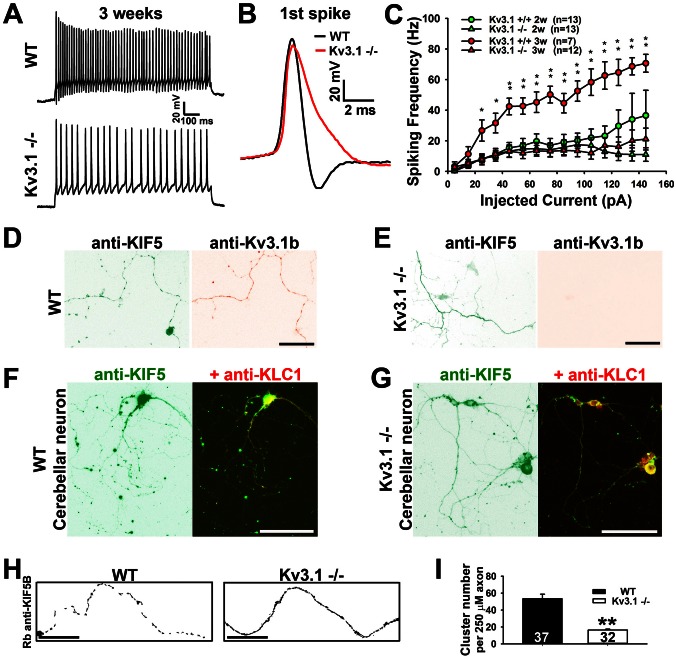
The conventional kinesin motor transports many different cargos to specific locations in neurons. How cargos regulate motor function remains unclear. Here we focus on KIF5, the heavy chain of conventional kinesin, and report that the Kv3 (Shaw) voltage-gated K(+) channel, the only known tetrameric KIF5-binding protein, clusters and activates KIF5 motors during axonal transport. Endogenous KIF5 often forms clusters along axons, suggesting a potential role of KIF5-binding proteins. Our biochemical assays reveal that the high-affinity multimeric binding between the Kv3.1 T1 domain and KIF5B requires three basic residues in the KIF5B tail. Kv3.1 T1 competes with the motor domain and microtubules, but not with kinesin light chain 1 (KLC1), for binding to the KIF5B tail. Live-cell imaging assays show that four KIF5-binding proteins, Kv3.1, KLC1 and two synaptic proteins SNAP25 and VAMP2, differ in how they regulate KIF5B distribution. Only Kv3.1 markedly increases the frequency and number of KIF5B-YFP anterograde puncta. Deletion of Kv3.1 channels reduces KIF5 clusters in mouse cerebellar neurons. Therefore, clustering and activation of KIF5 motors by Kv3 regulate the motor number in carrier vesicles containing the channel proteins, contributing not only to the specificity of Kv3 channel transport, but also to the cargo-mediated regulation of motor function.

Keywords: Axonal transport; Cargo-motor interaction; Kinesin light chain; Molecular motor; Synaptic protein; Voltage-gated potassium channel.


Figures

Fig. 1.
Fig. 1.
Clustering of endogenous KIF5 motors in cultured hippocampal neurons. The low-density culture of hippocampal neurons from rat embryos (at E18) was used here at 10 DIV. (A) Endogenous KIF5B motors cluster (arrowhead) at the axonal growth cone. F-actin was labeled with phalloidin Alexa Fluor 546 (red in merged). KIF5B was stained with a rabbit anti-KIF5B antibody (green in merged) and β-tubulin was labeled with a mouse anti-β-tubulin antibody (blue in merged). Signals are inverted in single-channel images. (B,C) Clusters of KIF5B along axons with (indicated by white arrowheads) and without colocalizing F-actin (indicated by black arrows). Scale bars: 10 µm.
Fig. 2.
Fig. 2.
Direct binding between the Kv3.1 T1 and KIF5 tail domains. (A) Diagram of the Kv3.1 T1-binding site (T70) in KIF5 tail. KIF5 and Kv3.1 are shown as a dimer and a tetramer, respectively. For simplicity, only one Kv3.1 C-terminal domain is shown. In the sequence alignment of human KIF5A, KIF5B and KIF5C, conserved residues are highlighted in yellow. The numbers indicate residue positions in KIF5B. GST fusion proteins of KIF5B tail fragments that bind or fail to bind to His-31T1 in pulldown assays are indicated in black or green, respectively. Residue numbers of tail fragments are indicated above the lines. The motor inhibiting site and three basic residues crucial for binding to Kv3.1 T1 are indicated with blue and red brackets, respectively. (BE) In vitro binding assays to map the Kv3.1 T1-binding site in the KIF5B tail domain. (B) Mapping the minimal region of the Kv3.1 T1-binding site. (C) The N-terminal half of T70 binds to His-31T1. (D) Neither half of the fragment 892–934 binds to His-31T1. (E) Mutating R892K893R894 to three aspartic acid residues to switch positive to negative charges completely eliminated the binding of T70 to His-31T1. Molecular weights are indicated on the left in kDa. Pulldown assays were repeated at least three times.
Fig. 3.
Fig. 3.
Binding affinity and stoichiometry of Kv3.1 T1 and KIF5B tail domains. (A) Purified GST-Tail and GST-T70, but not GST-T70RKR pulled down purified His-31T1, indicated by the Colloidal Blue staining. Molecular weights (in kDa) are indicated on the left. (B) Binding response traces of His-31T1 to immobilized GST-T70 (left), GST-Tail892–934 (middle) and GST-T70RKR (right), in the SPR experiment. Solutions containing six different concentrations (0, 200 nM, 600 nM, 2 µM, 10 µM and 100 µM) of His-31T1 were flowed over the chip. The spikes in the traces at the highest concentration of His-31T1 are most probably due to buffer change. Triton X-100 (0.1%) was included in the stock buffer of high-concentration purified proteins to increase the solubility, but not in the binding buffer used in SPR. (C) Estimation of the stoichiometry of the Kv3.1 T1 and KIF5B tail binding complex. In the left panel, purified GST-T70 (3.2 µg) was first coated on glutathione beads (30 µl total volume; 100% binding assumed), which were further incubated with different amounts of purified His-31T1. The molar ratios between His-31T1 (∼20 kDa) and GST-T70 (∼32 kDa) were 0∶1, 0.4∶1, 1∶1, 4∶1, 10∶1, 30∶1, 60∶1, 100∶1. The right panel shows the staining intensity graph of GST-T70 (black circles) and His-31T1 (red triangles). The protein gel was scanned as a TIFF image file and the intensity of protein bands were measured and subtracted with the background value.
Fig. 4.
Fig. 4.
Kv3.1 T1 competes with microtubules but not KLC1 for binding to KIF5B tail. (A) Diagram of the KIF5B tail domain and five of its binding proteins. The KLC-binding site (T63) is located between residues 758 and 820, highlighted in blue. The Kv3 T1-binding site (T70) is between residues 865 and 934, highlighted in red, which overlaps with binding sites for KIF5 motor domain, microtubules and SNAP25. (B) His-31T1 did not compete with His-KLC1 for binding to GST-Tail. GST-Tail (3.5 µg) was first coated on glutathione beads and further used to pull down purified His-KLC1 (5.6 µg, so that GST-Tail and His-KLC1 are in a 1∶1 molar ratio) mixed with different amounts of His-31T1. Molar ratios between His-31T1 and His-KLC1 used were 0∶1, 0.3∶1, 1∶1, 3∶1 and 10∶1. (C) Western blotting with an anti-6×His antibody in an experiment similar to B, except that a lower amount of GST-Tail (2.5 µg), an additional condition (30∶1) and 10% loading compared to protein gels were used. (D) Increased amount of His-Motor reduced the amount of His-31T1 binding to GST-Tail. (E,F) Purified GST-Tail and GST-T70, but not GST, GST-T63 or GST-T70RKR, bound to microtubules. Microtubules were assembled in vitro with purified tubulins for 20 minutes, then incubated with purified GST fusion proteins (around 5 µg total) for another 30 minutes and pelleted with a high-speed spin. Pellets were resolved with sample buffer equal to the supernatant in volume, and equal volume of supernatants and dissolved pellets were loaded on a SDS-PAGE gel. Protein bands were stained with Colloidal Blue (top). GST fusion proteins were further revealed with western blotting using an anti-GST antibody (10% loading) (bottom). (G) Purified GST-T70 and His-31T1 were mixed in four different molar ratios, 1∶0, 1∶1, 1∶4 and 1∶8. In this experiment, microtubules were assembled in the presence of 100 µM paclitaxel to further stabilize assembled microtubules. The supernatants and pellets were resolved in SDS-PAGE and revealed by both Colloidal Blue staining (top) and western blotting (10% loading) using an anti-GST antibody (bottom). Since there was no washing step after assembled microtubules were pelleted, very faint bands in the pellet lane are due to supernatant contamination, even when the protein does not bind to microtubules. All in vitro binding experiments were repeated at least three times. Molecular weights are indicated on the left in kDa. S, supernatant; P, pellet; black arrowheads, GST fusion proteins; red arrowheads, His-31T1.
Fig. 5.
Fig. 5.
KIF5-binding proteins differentially regulate KIF5B tail localization. (A) Co-staining of cultured hippocampal neurons at 20 DIV for endogenous KIF5 (mouse H2 antibody in green) and its binding proteins (Kv3.1b, KLC1, SNAP25 and VAMP2; in red). White arrows, colocalizing puncta; white arrowheads, non-colocalizing puncta. (B) CFP-Tail was restricted in somatodendritic regions in 8-DIV neurons expressing CFP-Tail and YFP (top). Coexpression of YFP-KLC1 (green in merged) brought CFP-Tail (blue in merged) into distal axons (bottom). Black arrows, axons; black arrowheads, dendrites. (C) CFP-Tail intensity profiles along axons in the presence of various YFP fusion proteins. Only the expression of YFP-KLC1, but not YFP-Kv3.1b, YFP-SNAP25 nor YFP-VAMP2, targeted CFP-Tail into distal axons. (D) Strong FRET signals (inverted in single channel and red in merged) were detected along axons between CFP-Tail (blue) and YFP-KLC (green); 17 out of 19 neurons had strong FRET signals. (E) Strong FRET signals were also detected in the soma of transfected neurons. Scale bars: 25 µm (A); 80 µm (B).
Fig. 6.
Fig. 6.
Mutating the three charged residues or the presence of Kv3.1 clusters KIF5B-YFP. (A) Relatively smooth distribution of KIF5B-YFP (green) along axons of hippocampal neurons (top), which were transfected at 5 DIV, fixed and stained for axonal marker, Tau1 (red), two days later. Highly clustered pattern of KIF5BRKR-YFP (green) along axons (labeled for Tau1 in red) (bottom). Arrowheads indicate clusters of KIF5BRKR-YFP along the axon segment. (B) Distribution patterns of KIF5B-YFP (green in merged) when coexpressed with either CFP-KLC1 (top) or CFP-Kv3.1b (bottom) in hippocampal neurons. White arrows indicate colocalizaing clusters. (C) Distribution patterns of KIF5BRKR-YFP (green in merged) when coexpressed with either CFP-KLC1 (top) or CFP-Kv3.1b (bottom) in hippocampal neurons. YFP is in green and CFP is in blue in merged images. Signals are inverted in single-channel images. White arrows, colocalizating clusters; black arrows, KIF5BRKR-YFP clusters without CFP-Kv3.1b. (D) Profiles of fluorescence intensity along axons in B (top) and C (bottom). (E) Summary of the clustering effect of CFP-tagged KIF5-binding proteins on KIF5B-YFP (top) and KIF5BRKR-YFP (bottom). Scale bars: 10 µm (A); 100 µm (B,C).
Fig. 7.
Fig. 7.
CFP-Kv3.1b, but not CFP-KLC1, CFP-SNAP25 and CFP-VAMP2, increased the mobility of KIF5B-YFP puncta. (A) Kymograph of anterograde transport of KIF5B-YFP puncta along an axonal segment. (B) Kymograph of anterograde transport of KIF5B-YFP puncta along an axonal segment in the presence of CFP-Kv3.1b. (C) Kymograph of anterograde transport of KIF5B-YFP puncta along an axonal segment in the presence of CFP-KLC1. (D) Kymograph of anterograde transport of KIF5BRKR-YFP puncta along an axonal segment. (E) Kymograph of anterograde transport of KIF5BRKR-YFP puncta along an axonal segment in the presence of CFP-Kv3.1b. (F) Kymograph of anterograde transport of KIF5BRKR-YFP puncta in the presence of CFP-KLC1. Green arrows indicate anterograde-moving puncta. (G) Frequency of axonal transport of KIF5B-YFP puncta in the presence of CFP-Kv3.1b (red), CFP-KLC1 (green), CFP-SNAP25 (yellow), CFP-VAMP2 (blue) or alone (black). (H) Frequency of axonal transport of KIF5BRKR-YFP puncta in the presence of CFP-tagged proteins. The movie number is given as ‘n’, which shows the number of movies for each condition. Statistical results were obtained from at least five independent transfections.
Fig. 8.
Fig. 8.
Tetrameric Kv3 channels markedly increase the KIF5B-YFP number in a carrier vesicle. (A) Quantification of the YFP fluorescence of anterogradely moving puncta containing KIF5B-YFP along an axonal segment either alone (left) or in the presence of CFP-Kv3.1b (middle) or CFP-KLC1 (right). The image of axonal segment is on the left and the intensity profile along a 10-µm line crossing the axon is on the right. White arrowheads indicate anterogradely moving puncta. (B) Quantification of the YFP fluorescence of anterogradely moving puncta containing KIF5BRKR-YFP along an axonal segment either alone (left), or in the presence of CFP-Kv3.1b (middle) or CFP-KLC1 (right). White arrowheads indicate anterogradely moving puncta. (C) Summary of estimated numbers of KIF5B-YFP dimers or KIF5BRKR-YFP dimers in various puncta under different coexpression conditions. One-way ANOVA followed by Dunn's test, **P<0.01; *P<0.05; number of experiments is indicated for each bar.
Fig. 9.
Fig. 9.
KIF5 clusters reduced in cerebellar neurons of Kv3.1 knockout mice. (A) Expression of Kv3.1b, KIF5 and KIF5-binding proteins in brains of Kv3.1 knockout (−/−) and wild-type (+/+) mice. Soluble fractions (left) and crude membranes (right) are compared. Molecular weights (in kDa) are indicated on the left. (B) Genotyping of Kv3.1 heterozygotes (+/−), homozygotes (−/−), and wild-type mice. DNA ladders are on the left in bp. (C,D) Kv3.1b and KIF5B staining patterns in coronal sections of cerebellum from wild-type (C) and Kv3.1 KO (D) mice. P, Purkinje cell layer; GL, granule cell layer; ML, molecular layer. (E) To quantify the KIF5B clusters from the wild-type (left) and Kv3.1−/− (right) sections, images were thresholded and binarized to show pixel clusters. (F) Summary of the clusters per image (40× objective lens). The number of experiments is indicated within the bars;*P<0.05 (t-test). Scale bars: 300 µm (C,D); 100 µm (E).
Fig. 10.
Fig. 10.
Deletion of Kv3.1 reduces KIF5B clusters along axons of cultured cerebellar neurons. Cerebellar neurons were cultured from wild-type and Kv3.1−/− mouse pups (1–2 postnatal days) for 3 weeks. (A) Action potentials induced by a square-pulse current injection (1-second duration; 140 pA) from cultured cerebellar neurons (21 DIV) of wild-type (top) and Kv3.1 knockout (bottom) mice. (B) Waveforms of the 1st action potentials in A. (C) Input-output relationships of cultured cerebellar neurons from wild-type (circles) and Kv3.1 KO (triangles) mice. 2w, neurons before 2 weeks old (10–12 DIV); 3w, neurons around 3 weeks old (21 DIV). (D,E) Co-staining of endogenous KIF5 (green) and Kv3.1b (red) along axons of cultured cerebellar neurons from wild-type and Kv3.1−/− mice. (F) Endogenous KIF5B (green) and KLC1 (red) staining pattern in cultured wild-type cerebellar neurons at 20 DIV. (G) Endogenous KIF5B and KLC1 staining pattern in cultured Kv3.1 KO cerebellar neurons at 20 DIV. (H) To quantify the KIF5B clusters from the wild-type (left) and Kv3.1−/− (right) cerebellar neuron axons, images were thresholded and binarized to show pixel clusters. (I) Quantification of results shown in H. The number of experiments is indicated within the bars; *P<0.05, **P<0.01 (t-test). Scale bars: 25 µm (D,E); 100 µm in (F,G), 15 µm (H).

References

    1. Andrews S. B., Gallant P. E., Leapman R. D., Schnapp B. J., Reese T. S. (1993). Single kinesin molecules crossbridge microtubules in vitro. Proc. Natl. Acad. Sci. USA 90, 6503–6507 10.1073/pnas.90.14.6503 - DOI - PMC - PubMed
    1. Barry J., Gu C. (2012). Coupling mechanical forces to electrical signaling: molecular motors and intracellular transport of ion channels Neuroscientist [Epub ahead of print] doi: 10.1177/1073858412456088 10.1177/1073858412456088 - DOI - PMC - PubMed
    1. Barry J., Gu Y., Gu C. (2010). Polarized targeting of L1-CAM regulates axonal and dendritic bundling in vitro. Eur. J. Neurosci. 32, 1618–1631 10.1111/j.1460-9568.2010.07447.x - DOI - PMC - PubMed
    1. Bean B. P. (2007). The action potential in mammalian central neurons. Nat. Rev. Neurosci. 8, 451–465 10.1038/nrn2148 - DOI - PubMed
    1. Bi G. Q., Morris R. L., Liao G., Alderton J. M., Scholey J. M., Steinhardt R. A. (1997). Kinesin- and myosin-driven steps of vesicle recruitment for Ca2+-regulated exocytosis. J. Cell Biol. 138, 999–1008 10.1083/jcb.138.5.999 - DOI - PMC - PubMed

Publication types

MeSH terms