. 2013 Apr 15;190(8):3939-48.
doi: 10.4049/jimmunol.1202582. Epub 2013 Mar 13.

Conversion of peripheral blood NK cells to a decidual NK-like phenotype by a cocktail of defined factors

Affiliations

Conversion of peripheral blood NK cells to a decidual NK-like phenotype by a cocktail of defined factors

Ana Sofia Cerdeira et al. J Immunol. .

Abstract

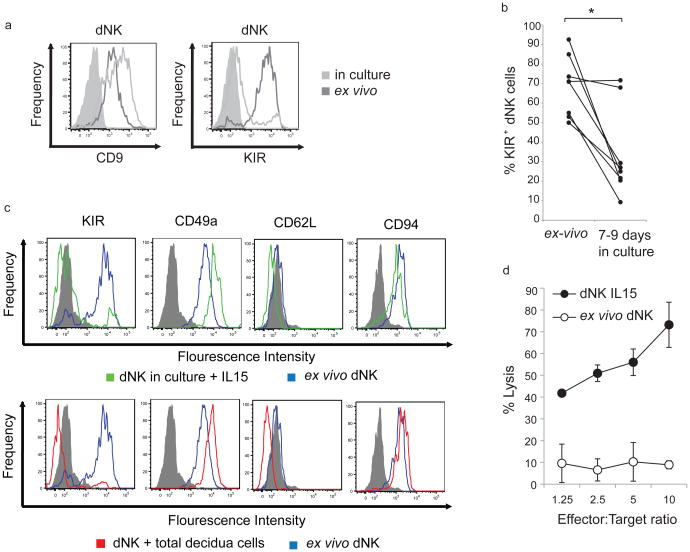
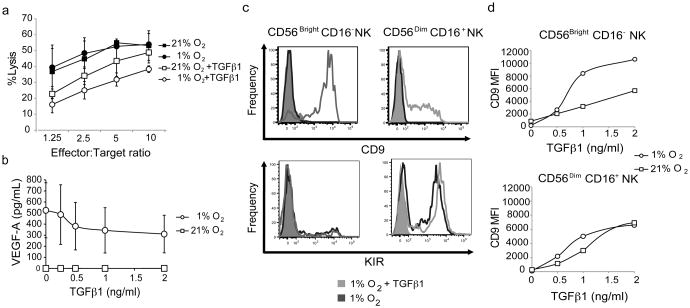
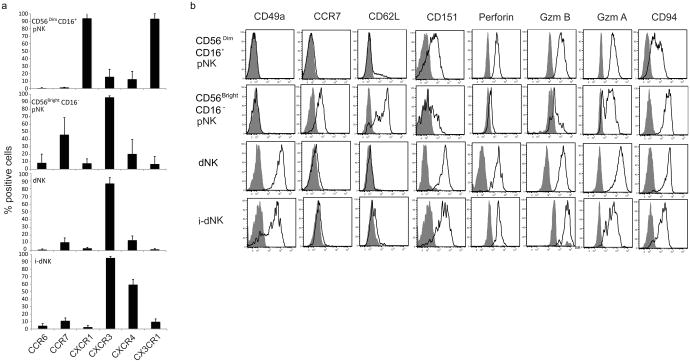
NK cells that populate the decidua are important regulators of normal placentation. In contrast to peripheral blood NK cells, decidual NK (dNK) cells lack cytotoxicity, secrete proangiogenic factors, and regulate trophoblast invasion. In this study we show that exposure to a combination of hypoxia, TGF-β1, and a demethylating agent results in NK cells that express killer cell Ig-like receptors, the dNK cell markers CD9 and CD49a, and a dNK pattern of chemokine receptors. These cells secrete vascular endothelial growth factor (a potent proangiogenic molecule), display reduced cytotoxicity, and promote invasion of human trophoblast cell lines. These findings have potential therapeutic applications for placental disorders associated with altered NK cell biology.


Figures

Figure 1
Figure 1. Reversibility of the dNK cell phenotype
a) CD9 (left panel), KIR (right panel) expression by ex vivo CD3CD56Bright CD16 dNK cells (dark gray histograms) and CD3 CD56Bright CD16 NK cells from 7 to 9 days dNK cell cultures in IL-15 complete media (light gray histograms). Filled histograms, isotype control. b) Percentage of KIR+ cells among ex-vivo FACS sorted dNK cells and FACS sorted dNK cells cultured for 7 to 9 days in IL-15 complete media evaluated by flow cytometry. Each line represents an independent sample. * p-value=0.02. c) KIR, CD49a, CD62L and CD94 expression by ex vivo CD3CD56Bright CD16 dNK cells (blue histograms) and CD3 CD56Bright CD16- NK cells from 7 to 9 days dNK cell cultures in which cells were seeded in IL-15 complete media (green histograms in top panels) or on total decidua cells (red histograms in bottom panels). Gray histograms: isotype control. d) Cytotoxic activity of ex vivo dNK cells (white circles) and dNK cells cultured for a week in IL-15 complete media (black circles) on K562 cells evaluated by 51Chromium release assays. Error bars represent standard deviation. Average of 3 experiments.
Figure 2
Figure 2. Hypoxia enriches pNK cell cultures in CD56BrightCD16-cells and turns pNKs into pro-angiogenic cells
a) CD56 and CD16 expression profile of pNK cells cultured for one week under hypoxia (1% O2) or normal tissue culture conditions (21% O2) in the presence of IL-15. Squares delineate CD56Bright CD16 NK and CD56Dim CD16+ NK cell populations. Numbers indicate percentage of cells. b) CD56Bright CD16 NK cell to CD56Dim CD16+ NK cell ratio in hypoxia and 21% O2 cultures in experiments similar to the one shown in A. Each line represents an independent experiment. ** p-value=6×10⁻⁵ by paired t-test. c) VEGF-A levels in the supernatants of pNK cells, FACS sorted CD56Bright CD16 pNK cells and FACS sorted CD56Dim CD16+ pNK cells cultured under 21% or 1% O2 in the presence of IL-15 for one week. Cells were seeded at a density of 4×10⁴ cells in 300 μl of media. Error bars represent standard deviation. Average of 3 experiments. * p-value=0.029, ** p-value=0.009 d) Tube formation by HUVECs in the presence of supernatants of pNK cells seeded at 1×10⁶ cells per ml and cultured one week under 21% O2 or 1% O2. Representative fields (left) and tube formation quantitative evaluation (right) by the average percentage area per field covered by HUVECs. Results are average of 6 experiments. Error bars represent standard deviation. ** p-value=0.002. e) Cytotoxic activity of freshly isolated pNK and of pNK cells cultured in the presence of IL-15 under 21% O2 or 1% O2 on K562 target cells. Average of 2 51Chromium release assays. f) CD9 (top panel) and KIR (bottom panel) expression by CD3CD56Bright CD16 NK and CD3-CD56Dim CD16+ NK cells from pNK cell cultures maintained for a week under 1% O2 (black histogram) or 21% O2 (gray histogram) in the presence of 10 ng/mL IL-15. In the top panels histograms are not visualized due to overlap with isotyope control..Filled histograms, isotype controls. Histograms are representative of 3 experiments.
Figure 3
Figure 3. NK cell incubation under hypoxia in the presence of TGFβ1 results in CD9+NK cells that secrete VEGF-A and have reduced cytotoxicity
a) Cytotoxic activity of pNK cells cultured one week under 21% O2or 1% O2 in the presence or absence of 2ng/ml TGFβ1, on K562 target cells. Average of 2 51Chromium release assays. b) VEGF-A secretion by pNK cells cultured for a week under 21% O2 (squares) or 1% O2 (circles) in the presence of different concentrations of TGFβ1. Average of 4 experiments. Error bars represent standard deviation. Error bars of cultures under 21% O2 are not visualized due to the reduced standard deviation c) CD9 (top panels) and KIR (bottom panels) expression by CD56Bright CD16 (left) and CD56Dim CD16+ (right) pNK cells from one week-long pNK cell cultures under 1% O2in the presence (light gray histograms) or absence (dark gray histograms) of 2ng/mL TGFβ1 evaluated by flow cytometry. Filled histograms, isotype control. CD9 histograms are representative of 10 experiments. KIR histograms are representative of 5 experiments. d) Mean Florescence Intensity (MFI) of CD9 expression by CD56Bright CD16NK cells (top panel) and CD56Dim CD16+ (bottom panel) from one week long pNK cell cultures under hypoxia (1% O2, circles) or 21% O2 (squares) in the presence of different concentrations of TGFβ1. Results from one representative experiment. Similar results were obtained in seven out of ten experiments.
Figure 4
Figure 4. Aza, hypoxia and TGFβ1 combined induce CD9+KIR+dNK-like cells that secrete VEGF-A and have reduced cytotoxicity
a) KIR (top panels) and CD9 (bottom panels) expression by CD56Bright CD16 (left) and CD56Dim CD16+ (right) pNK cells from one week-long pNK cell cultures under 1% O2 in the presence of 2ng/mL TGFβ1 with (dark gray histograms) or without (light gray histogram) the addition of 1μM Aza, evaluated by flow cytometry. Tinted histograms, isotype control. Bars and numbers indicate the percentage of KIR+ cells in the corresponding NK cell subset in cultures performed under 1% O2 in the presence of Aza and TGFβ1. One experiment representative of 3. b) Percentage of KIR+ cells among CD56Bright CD16 pNK cells from a one week long culture under 1% O2 (circles) or 21% O2 (squares), in the presence (white symbols) or absence (black symbols) of 2ng/mL TGFβ1, at different concentrations of Aza. One experiment representative of two. c) VEGF-A content in the supernatants of one week long cultures of pNK cells, seeded at 1×10⁶ cells /mL, in the presence of TGFβ1 under hypoxia (circles) or 21% O2 (squares) at different concentrations of Aza. Average of 2 experiments d) Cytotoxic activity of effector pNK cells cultured for a week under hypoxia in the presence (triangles) or absence (circles) of 1μM Aza, in the presence (white symbols) or absence (black symbols) of 2 ng/mL TGFβ1, on K562 target cells. Results are average of 2 independent experiments.
Figure 5
Figure 5. i-dNK cells express chemokine receptors and molecules differentially expressed by dNK and pNK cells in a pattern similar to dNK cells
A) Chemokine receptor expression profile of fresh CD56Dim CD16+ pNK , fresh CD56Bright CD16 pNK, fresh dNK and i-dNK cells (gated on CD56Bright CD16 cells) evaluated by flow cytometry. The percentage of positive cells for each chemokine receptor is shown. Average of 4 independent donors. Error bars represent standard deviation. B) CD49a, CCR7, CD62L, CD151, Perforin, Granzyme B, Granzyme A and CD94 expression by CD56Dim CD16+pNK , CD56Bright CD16 pNK, dNK and CD56Bright CD16 i-dNK cells . Gray histograms isotype control. Histogram plots were gated on CD3 cells and are representative of 3 or 4 independent donors.
Figure 6
Figure 6. Reversibility of the phenotype of i-dNK cells
a) VEGF-A content in the supernatant of pNK cells that were cultured for a week under i-dNK inducing conditions (1% O2 in the presence of 2 ng/ml TGFβ-1 and 1 μM Aza) and then replated for a second week either under i-dNK inducing conditions (1% O2 + TGFβ-1 + Aza) or under basal conditions (21% O2). Average of 4 independent experiments. ** p-value=0.0099 by two-tailed Student t-test. b) CD9 (top panel) and KIR (lower panel) expression by CD56Bright CD16 (left) and CD56Dim CD16+ (right) cells from pNK cultures similar to those described in a. dark gray histograms: i-dNK inducing conditions (1% O2 + TGFβ-1 + Aza). light gray histograms: standard tissue culture basal conditions (21% O2). One representative experiment out of 3 total is shown.
Figure 7
Figure 7. NK cells cultured under i-dNK inducing conditions promote HTR trophoblast cell invasion
a) Representative photomicropgraphs of immortalized extravillous trophoblast HTR-8-svNeo cells in a Matrigel invasion assay. HTR cells were seeded in the upper chamber of matrigel coated migration wells. pNK cells that have been cultured for a week under 1% O2 in the presence of 2 ng/ml TGFβ1 and 1μM Aza (i-dNK, right panel), or under 21% O2 and IL-15 as control (left panel) were seeded in the lower chamber. b) i-dNK and control cell data expressed as invasion normalized to control cells (pNK cells from the same donor maintained under 21%O2 and IL-15 ). Each dot represents one donor. N = 10. * p-value= 0.039. c) Invasion data normalized to media alone in the absence of NK cells for dNK cells from 3 donors , gestational ages 7, 9 and 10 weeks, or i-dNK cells from 4 separate donors (black bars), and reverted i-dNK cells, from the same 4 donors, that were maintained a second week under standard tissue culture basal conditions (21% O2 +IL-15) (white bars).

References

    1. Caligiuri MA. Human natural killer cells. Blood. 2008;112:461–469. - PMC - PubMed
    1. Orange JS, Fassett MS, Koopman LA, Boyson JE, Strominger JL. Viral evasion of natural killer cells. Nat Immunol. 2002;3:1006–1012. - PubMed
    1. Vivier E, Tomasello E, Baratin M, Walzer T, Ugolini S. Functions of natural killer cells. Nat Immunol. 2008;9:503–510. - PubMed
    1. Bulmer JN, Morrison L, Longfellow M, Ritson A, Pace D. Granulated lymphocytes in human endometrium: histochemical and immunohistochemical studies. Hum Reprod. 1991;6:791–798. - PubMed
    1. Bulmer JN, Williams PJ, Lash GE. Immune cells in the placental bed. Int J Dev Biol. 2010;54:281–294. - PubMed

Publication types

MeSH terms