. 2013 May;25(5):e304-14.
doi: 10.1111/nmo.12085. Epub 2013 Mar 12.

Circumferential and functional re-entry of in vivo slow-wave activity in the porcine small intestine

Affiliations

Circumferential and functional re-entry of in vivo slow-wave activity in the porcine small intestine

T R Angeli et al. Neurogastroenterol Motil. 2013 May.

Abstract

Background: Slow-waves modulate the pattern of small intestine contractions. However, the large-scale spatial organization of intestinal slow-wave pacesetting remains uncertain because most previous studies have had limited resolution. This study applied high-resolution (HR) mapping to evaluate intestinal pacesetting mechanisms and propagation patterns in vivo.

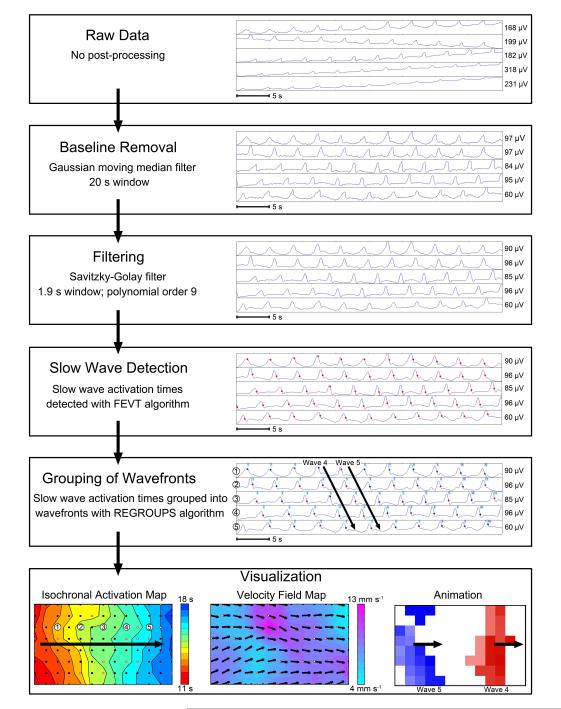
Methods: HR serosal mapping was performed in anesthetized pigs using flexible arrays (256 electrodes; 32 × 8; 4 mm spacing), applied along the jejunum. Slow-wave propagation patterns, frequencies, and velocities were calculated. Slow-wave initiation sources were identified and analyzed by animation and isochronal activation mapping.

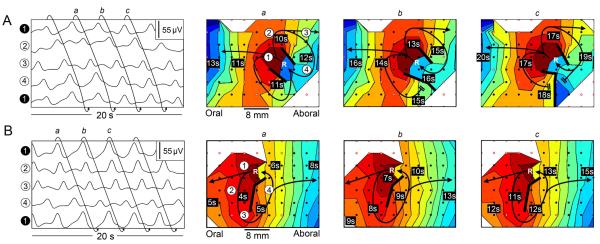
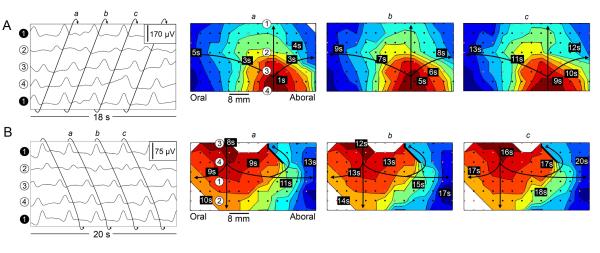
Key results: Analysis comprised 32 recordings from nine pigs (mean duration 5.1 ± 3.9 min). Slow-wave propagation was analyzed, and a total of 26 sources of slow-wave initiation were observed and classified as focal pacemakers (31%), sites of functional re-entry (23%) and circumferential re-entry (35%), or indeterminate sources (11%). The mean frequencies of circumferential and functional re-entry were similar (17.0 ± 0.3 vs 17.2 ± 0.4 cycle min(-1) ; P = 0.5), and greater than that of focal pacemakers (12.7 ± 0.8 cycle min(-1) ; P < 0.001). Velocity was anisotropic (12.9 ± 0.7 mm s(-1) circumferential vs 9.0 ± 0.7 mm s(-1) longitudinal; P < 0.05), contributing to the onset and maintenance of re-entry.

Conclusions & inferences: This study has shown multiple patterns of slow-wave initiation in the jejunum of anesthetized pigs. These results constitute the first description and analysis of circumferential re-entry in the gastrointestinal tract and functional re-entry in the in vivo small intestine. Re-entry can control the direction, pattern, and frequency of slow-wave propagation, and its occurrence and functional significance merit further investigation.


Figures

Figure 1
Figure 1
Pipeline of the data analysis process from raw data through visualization. Sample electrograms are shown for each step, and each step is described in the ‘Signal Processing and Analysis’ section of the methods. Identified slow wave activation times are marked by red dots. Three forms of visualization are shown. The isochronal activation map shows the propagation of Wave 4 from the electrogram above (see Figure 2 for a complete description of the activation maps). The velocity field map displays the magnitude as a color gradient and the direction at each electrode as an arrow. A single frame of the propagation animation shows multiple waves in the mapped area at one time, represented in different colors and corresponding to Wave 4 and Wave 5 in the electrogram above.
Figure 2
Figure 2
Antegrade and retrograde slow wave propagation. An 8 × 13 electrode section of the array is shown in these examples. The electrode array was wrapped around the circumference of the intestine such that the top and bottom of each map correspond to nearly-adjacent tissue at the mesenteric border. Electrograms are shown on the left, and isochronal activation maps for three successive slow wave cycles (a, b, and c) are shown on the right. The displayed electrograms correspond to the channels labeled on maps A(a) and B(a). Each activation map shows a single wavefront, with each color band indicating the area of slow wave propagation per 0.5 s in A and 1.0 s in B, progressing from red (early) to blue (late). Each black dot represents an electrode, and white dots outlined in red represent electrodes where activity was interpolated. A. Consistent antegrade propagation. Slow wave activity originated oral to the array and propagated antegrade across the array. B. Consistent retrograde propagation. Slow wave activity originated aboral to the array and propagated retrograde across the array. (See also: Supplemental Animation 2A and Supplemental Animation 2B of the same data).
Figure 3
Figure 3
Focal pacemaker. The figure panel is arranged as described in Figure 2. Each map depicts a single wavefront and each color band represents 0.25 s of propagation time. An 8 × 11 electrode section of the array is shown. Slow wave activity was observed to originate at a point near the mesentery, and spread in all directions. The circumferentially-directed propagation traveled around the intestinal circumference (from top and bottom of map), colliding at a point approximately opposite the site of activation (near the middle of the map; also observed in converging waveforms in the electrograms). Focal pacemakers generated wavefronts traveling longitudinally along the intestine in both the antegrade and retrograde directions (see also: Supplemental Animation 3 of the same data).
Figure 4
Figure 4
Functional re-entry. The figure panels are arranged as described in Figure 2, with each map depicting a single re-entrant cycle and each color band representing the area of propagation per 0.5 s. Blank areas represent locations where data was not reliably recorded. An 8 × 10 electrode section of the array is shown in these examples. The top electrode in the electrogram (‘electrode 1’) is repeated at the bottom of the electrogram to demonstrate the continuous propagation. A. In this example, slow wave activity formed a ‘figure-of-eight’ re-entrant circuit where a single wavefront broke into two wavelets (wave fragments that separate from the main wavefront) that propagated in clockwise and anti-clockwise directions around two distinct lines of functional block. These wavelets repeatedly re-excited the same loops of tissue, reactivating after subsequent cycles (at point marked ‘R’ in maps a, b, and c) and forming a re-entrant circuit. In this example, the anti-clockwise propagation loop was slightly out-paced by the clockwise loop, causing the clockwise loop to become dominant and the anti-clockwise loop to collide and terminate at a functional block in maps b and c. B. An episode of functional re-entry from a second animal, occurring in an anti-clockwise direction. The loop of activation again traveled around a line of functional activation block and re-excited the same tissue circuit. In both A and B, wavefronts were seen to propagate antegrade and retrograde from the sites of functional re-entry, thereafter assuming ‘rings’ of activation moving longitudinally. (see also: Supplemental Animation 4A and Supplemental Animation 4B).
Figure 5
Figure 5
Circumferential re-entry. The figure panels are arranged as described in Figure 2, with each map depicting a single wavefront and each color band representing the area of propagation per 0.5 s. An 8 × 14 electrode section of the array is shown. A. Slow wave activity was observed to propagate from the bottom to top of the maps and re-enter at the bottom, illustrating a continuous loop wavefront that propagated circumferentially around the intestine (i.e., the wavefront at the top of map a propagated continuously onto bottom of map b, and so on). B. A further example from a second animal again illustrates a continuous loop of slow wave activity that propagated around the intestinal circumference, in this case in the opposite direction as in A. An additional conduction block was present in this case at the top of the map, represented by the thick black line. In A and B, ring wavefronts were observed to travel longitudinally antegrade and retrograde along the intestine from the site of circumferential re-entry (see also: Supplemental Animation 5A and Supplemental Animation 5B).
Figure 6
Figure 6
Mathematical properties of re-entry. Slow wave propagation is represented with arrows, where red represents the wavefront and white represents the excitable gap (see Table 1 for definition of terminology). A. Schematic of a focal pacemaker, shown on a cross-section of the intestine. Activity originates from a point represented with the asterisk, travels in both directions around the circumference of the intestine, and collides on the opposite side. B. Schematic of circumferential re-entry, shown on a cross-section of the intestine. A wavefront propagates continuously in a loop around the circumference of the intestine, re-exciting the same circuit of tissue over successive cycles. C. Schematic of functional re-entry, shown on the serosa of the intestine. Activity propagates in a loop around a functional block, represented by a thick black line. The functional block is created by the refractory period such that the leading edge of one cycle follows the refractory tail of the previous cycle. In both circumferential and functional re-entry, an excitable gap must be present between the leading edge of one cycle and the refractory period of the previous cycle to avoid a collision between the two, resulting in termination of the re-entry. D. Equations outlining the physical properties governing re-entrant slow wave activity.

References

    1. Huizinga JD, Lammers WJEP. Gut peristalsis is coordinated by a multitude of cooperating mechanisms. Am J Physiol Gastrointest Liver Physiol. 2009;296:1–8. - PubMed
    1. O’Grady G, Du P, Cheng LK, et al. The origin and propagation of human gastric slow wave activity defined by high-resolution mapping. Am J Physiol Gastrointest Liver Physiol. 2010;299(3):585–92. - PMC - PubMed
    1. Lammers WJEP, Ver Donck L, Stephen B, Smets D, Schuurkes JAJ. Origin and propagation of the slow wave in the canine stomach: the outlines of a gastric conduction system. Am J Physiol Gastrointest Liver Physiol. 2009;296:G1200–10. - PubMed
    1. Egbuji JU, O’Grady G, Du P, et al. Origin, propagation and regional characteristics of porcine gastric slow wave activity determined by high-resolution mapping. Neurogastroenterol Motil. 2010;22:e292–300. - PMC - PubMed
    1. Hasler WL. Small intestinal motility. In: Johnson LR, editor. Physiology of the Gastrointestinal Tract. Elsevier Academic Press; USA: 2006. pp. 935–64.

Publication types

MeSH terms