. 2013 May;19(5):329-36.
doi: 10.1111/cns.12084. Epub 2013 Mar 14.

The disturbance of hippocampal CaMKII/PKA/PKC phosphorylation in early experimental diabetes mellitus

Affiliations

The disturbance of hippocampal CaMKII/PKA/PKC phosphorylation in early experimental diabetes mellitus

Mei-Hua Liao et al. CNS Neurosci Ther. 2013 May.

Abstract

Background: Defining the impact of diabetes and related risk factors on brain cognitive function is critically important for patients with diabetes.

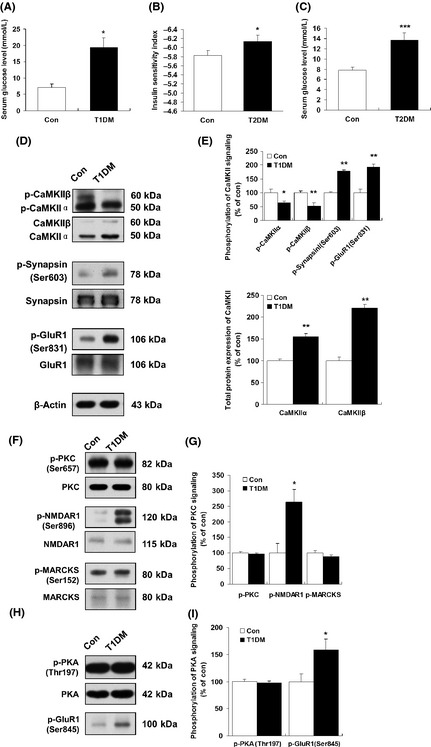
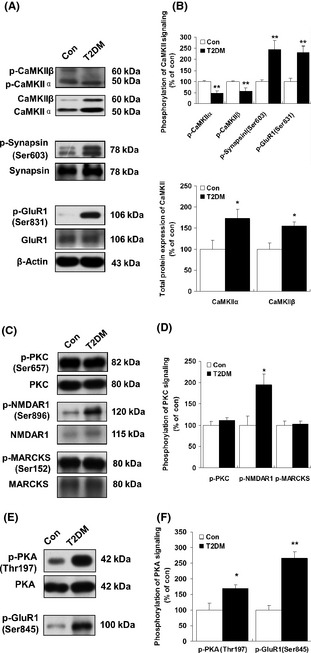
Aims: To investigate the alterations in hippocampal serine/threonine kinases signaling in the early phase of type 1 and type 2 diabetic rats.

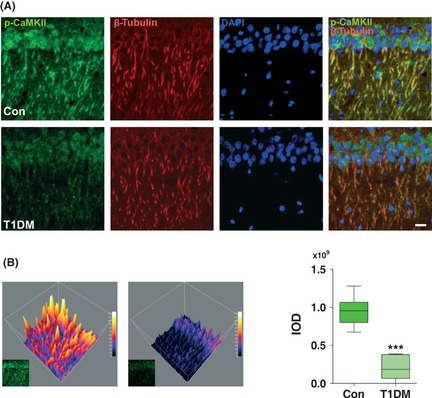
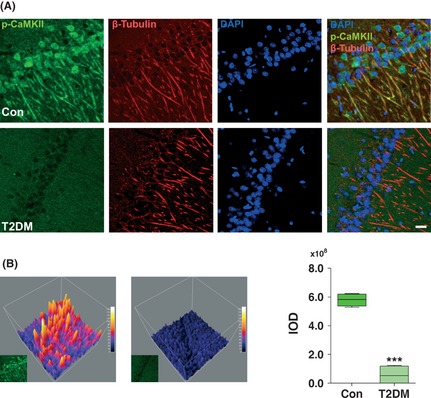
Methods: Early experimental diabetes mellitus was induced in rats with streptozotocin or streptozotocin/high fat. Changes in the phosphorylation of proteins were determined by immunoblotting and immunohistochemistry.

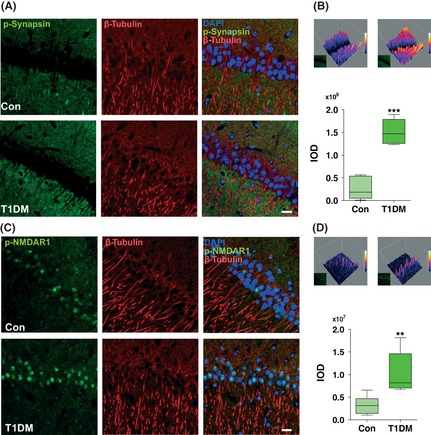
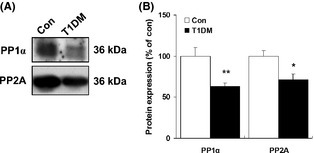
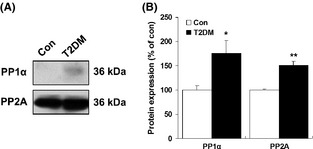
Results: Our data showed a pronounced decrease in the phosphorylation of Ca(2+) /calmodulin-dependent protein kinase II (CaMKII) in the hippocampi of both type 1 and type 2 diabetic rats compared with age-matched control rats. Unexpectedly, we found a significant increase in the phosphorylation of synapsin I (Ser 603) and GluR1 (Ser 831) in the same experiment. In addition, aberrant changes in hippocampal protein kinase C (PKC) and protein kinase A (PKA) signaling in type 1 and type 2 diabetic rats were also found. Moreover, PP1α and PP2A protein levels were decreased in the hippocampus of type 1 diabetic rats, but significantly up-regulated in type 2 diabetic rats.

Conclusions: The disturbance of CaMKII/PKA/PKC phosphorylation in the hippocampus is an early change that may be associated with the development and progression of diabetes-related cognitive dysfunction.


Conflict of interest statement

The authors declare no conflict of interest.

Figures

Figure 1
Figure 1
Decreased phosphorylation of CaMKII in the hippocampal region in type 1 diabetic rats. (A) Changes in blood glucose 30 days after STZ injection in type 1 diabetic rats. (B) Measurement of insulin sensitivity index in type 2 diabetic rats. (C) Changes in blood glucose 60 days after STZ/high‐fat treatment in type 2 diabetic rats. *< 0.05 versus control animals. ***< 0.001 versus control animals. Immunoblotting was carried out using antibodies recognizing phospho‐ or total protein. (D) The changes in CaMKII (Thr 286/287), synapsin I (Ser 603), and GluR1 (Ser 831) phosphorylation in the hippocampal region in type 1 diabetic rats were detected by western blots. (E) Quantitative analysis of relative CaMKII (Thr 286/287), synapsin I (Ser 603), and GluR1 (Ser 831) phosphorylation in type 1 diabetic rats was performed by densitometry. *< 0.05; **< 0.01 versus control rat (n = 5). (F) Representative western blots of PKC (Ser 657), N‐methyl‐D‐aspartate 1 (NMDAR1) (Ser 896), and Myristoylated alanine‐rich C‐kinase substrate (MARCKS) (Ser 152) phosphorylation. (G) Quantitative analysis of relative PKC (Ser 657), NMDAR1 (Ser 896), and MARCKS (Ser 152) phosphorylation in type 1 diabetic rats performed by densitometry. *< 0.05 versus control rat (= 5). (H) The expression of phospho‐PKA (Thr 197) and phospho‐GluR1 (Ser 845) in control and type 1 diabetic rats. (I) The results of (H) were quantitated by densitometry. *< 0.05 versus control rat (= 5). β‐Actin was used to ensure equal protein loading in each lane.
Figure 2
Figure 2
Changes in hippocampal phospho‐CaMKII in type 2 diabetic rats. (A) Hippocampal phospho‐CaMKII (Thr 286/287), phospho‐synapsin I (Ser 603), and phospho‐GluR1 (Ser 831) total proteins in type 2 diabetic rats were determined by western blotting (see Materials and methods). (B) The results of (A) were quantitated by densitometry. (C) Representative western blots of PKC (Thr 657), N‐methyl‐D‐aspartate 1 (NMDAR1) (Ser 896), and Myristoylated alanine‐rich C‐kinase substrate (MARCKS) (Ser 152) phosphorylation in control and type 2 diabetic rats. (D) The results of (C) were quantitated by densitometry. (E) Representative western blots of PKA (Thr 197) and GluR1 (Ser 845) phosphorylation in control and type 2 diabetic rats. (F) The results of (E) were quantitated by densitometry. β‐Actin was used to ensure equal protein loading in each lane. Data are expressed as percentage of values of control animals (mean ± SEM,= 5). *< 0.05;**< 0.01 versus control animals. T2DM, type 2 diabetes mellitus.
Figure 3
Figure 3
Changes in immunostaining of phospho‐CaMKII in hippocampus of type 1 diabetic rats. (A) Representative image of hippocampal CA1 pyramidal neurons stained with anti‐phospho‐CaMKII and β‐tubulin. Markedly decreased phospho‐CaMKII staining was observed by confocal microscopy in the hippocampus of type 1 diabetic rats. DAPI counterstaining indicates nuclear localization (blue). Scale bar = 50 μm. (B) Visualization of grayscale intensities of phospho‐CaMKII through 3D mesh plots (Left). The integrated optical density (IOD) determined by Graphpad Prism v5.0 according to the staining intensity of phospho‐CaMKII (Right). ***< 0.001 versus control (n = 6 slices from three animals for each group). T1DM, type 1 diabetes mellitus.
Figure 4
Figure 4
Changes in immunohistochemical expression of phospho‐CaMKII in the hippocampus of type 2 diabetic rats. (A) Immunohistochemical localization of phospho‐CaMKII was examined in the hippocampal CA1 region. Markedly decreased phospho‐CaMKII staining was observed by confocal microscopy in the hippocampus of type 2 diabetic rat. DAPI counterstaining indicates nuclear localization (blue). Scale bar = 50 μm. (B) The representative 3D filled surface plots (Left) indicate the grayscale intensities of phospho‐CaMKII in control and T2DM rats. The integrated optical density (IOD) determined by Graphpad Prism v5.0 according to the staining intensity of phospho‐CaMKII (Right). ***< 0.001 versus control (n = 6 slices from three animals for each group). T2DM, type 2 diabetes mellitus.
Figure 5
Figure 5
The STZ treatment induced aberrant immunostaining of phospho‐synapsin I (Ser 603) and phospho‐NMDAR1 (Ser 896) in type 1 diabetic rats. Immunohistochemical localization of phospho‐synapsin I (Ser 603) (A, B) and phospho‐NMDAR1 (Ser 896) (C, D) was examined in the hippocampus CA1 region. Markedly increased phospho‐synapsin I (Ser 603) (A) and phospho‐NMDAR1 (Ser 896) (C) stainings were observed by confocal microscopy in the hippocampus of type 1 diabetic rats. DAPI counterstaining indicates nuclear localization (blue). Scale bar = 50 μm. The 3D filled surface plots (Upper) indicate the grayscale intensities of phospho‐synapsin I (Ser 603) (B) and phospho‐NMDAR1 (Ser 896) (D). The integrated optical density (IOD) determined by Graphpad Prism v5.0 according to the staining intensity of proteins (Lower). **< 0.001; ***< 0.001 versus control (n = 6 slices from three animals for each group). T1DM, type 1 diabetes mellitus.
Figure 6
Figure 6
Changes in expression of hippocampal PP1α and PP2A in type 1 diabetic rats. (A) Representative western blots of PP1α and PP2A in the hippocampal region in type 1 diabetic rats. (B) Quantitative analysis of relative PP1α and PP2A in type 1 diabetic rats was performed by densitometry. Immunoblotting with an anti‐β‐actin antibody shows equal amounts of loaded protein in each lane. Data are expressed as percentage of values of control animals (mean ± SEM,= 5). *< 0.05; **< 0.01 versus control rat. T1DM, type 1 diabetes mellitus.
Figure 7
Figure 7
Western blot analysis of hippocampal PP1α and PP2A in type 2 diabetic rats. (A) Representative western blots of PP1α and PP2A in the hippocampal region of type 2 diabetic rats. (B) Quantitative analysis of relative levels of PP1α and PP2A in type 2 diabetic rats. β‐Actin was used to ensure equal protein loading in each lane. Data are expressed as percentage of values of control animals (mean ± SEM,= 5). *< 0.05; **< 0.01 versus control rat. T2DM, type 2 diabetes mellitus.

References

    1. Bree Aj, Puente EC, Daphna‐Iken D, Fisher SJ. Diabetes increases brain damage caused by severe hypoglycemia. Am J Physiol Endocrinol Metab 2009;297:E194–E201. - PMC - PubMed
    1. Anan F, Masaki T, Shimomura T, et al. Abdominal visceral fat accumulation is associated with hippocampus volume in non‐dementia patients with type 2 diabetes mellitus. Neuroimage 2010;49:57–62. - PubMed
    1. Hershey T, Perantie DC, Wu J, Weaver PM, Black KJ, White NH. Hippocampal volumes in youth with type 1 diabetes. Diabetes 2010;59:236–241. - PMC - PubMed
    1. Bruehl H, Wolf OT, Sweat V, Tirsi A, Richardson S, Convit A. Modifiers of Cognitive function and brain structure in middle‐aged and elderly individuals With type 2 diabetes mellitus. Brain Res 2009;1280:186–194. - PMC - PubMed
    1. Christman AL, Vannorsdall TD, Pearlson GD, Hill‐Briggs F, Schretlen DJ. Canial volume, mild cognitive deficits, and functional limitations associated with Diabetes in a community sample. Arch Clin Neuropsychol 2010;25:49–59. - PMC - PubMed

Publication types

MeSH terms

LinkOut - more resources