

Bed bugs evolved unique adaptive strategy to resist pyrethroid insecticides
- PMID: 23492626
- PMCID: PMC3596983
- DOI: 10.1038/srep01456
Bed bugs evolved unique adaptive strategy to resist pyrethroid insecticides
Abstract
Recent advances in genomic and post-genomic technologies have facilitated a genome-wide analysis of the insecticide resistance-associated genes in insects. Through bed bug, Cimex lectularius transcriptome analysis, we identified 14 molecular markers associated with pyrethroid resistance. Our studies revealed that most of the resistance-associated genes functioning in diverse mechanisms are expressed in the epidermal layer of the integument, which could prevent or slow down the toxin from reaching the target sites on nerve cells, where an additional layer of resistance (kdr) is possible. This strategy evolved in bed bugs is based on their unique morphological, physiological and behavioral characteristics and has not been reported in any other insect species. RNA interference-aided knockdown of resistance associated genes showed the relative contribution of each mechanism towards overall resistance development. Understanding the complexity of adaptive strategies employed by bed bugs will help in designing the most effective and sustainable bed bug control methods.
Figures
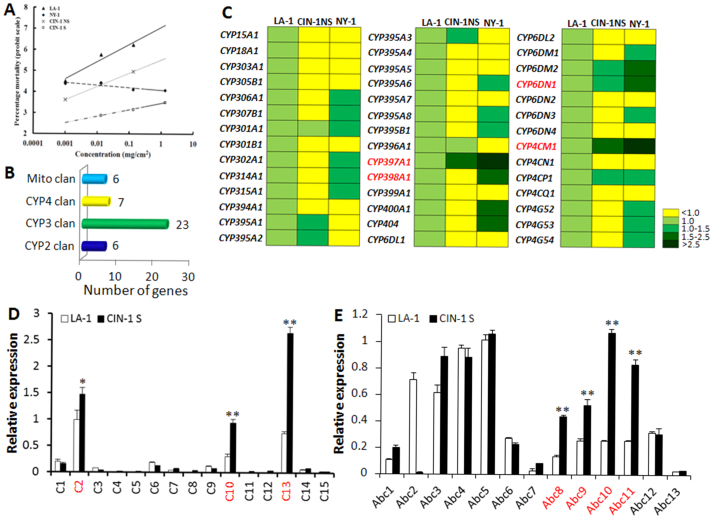
 ), a susceptible strain; NY-1 (
 ), a deltamethrin resistant strain; CIN-1 NS (x), a deltamethrin resistant strain without selection; and CIN-1 S (
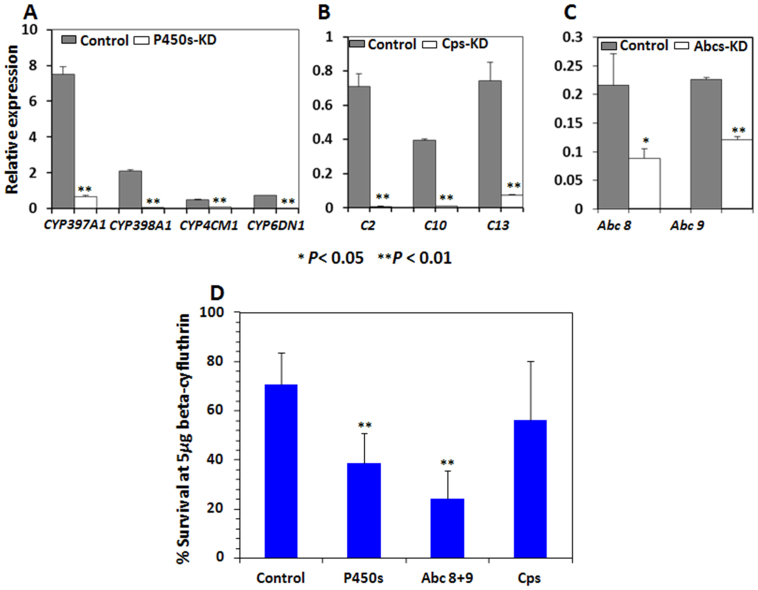
 ), a deltamethrin resistant strain after selection were exposed to serially diluted deltamethrin and the mortality was recorded and graphed. (B) Cytochrome P450 genes in C. lectularius. Totally 42 Cytochrome P450 genes (P450s) were identified through assembling of Cimex transcriptome and named by the P450 nomenclature committee. These genes fall into 4 clans, Mito CYP clan, CYP4 clan, CYP3 clan, and CYP2 clan. The number of P450s in each clan was labeled on the top of the column. (C) mRNA levels of 42 C. lectularius P450s in LA-1, CIN-1 NS, and NY-1. mRNA levels were shown as mean fold relative to their levels in LA-1. P450s highlighted in red showed the significant increase in CIN-1 NS and/or NY-1 compared to their levels in LA-1 (Student t-test, P < 0.05). (D) Relative mRNA levels of cuticular protein genes. Total RNAs were extracted from one week-old female adults were used in qRT-PCR to quantify relative mRNA levels in susceptible LA-1 as compared with the pyrethroid-resistant CIN-1 S. The data shown are mean + SEM (n = 3). Genes highlighted in red showed significant difference between LA-1 and CIN-1 S (Student's t test. * P < 0.05, ** P < 0.01). (E) Same as B except the mRNA levels of Abc transporter genes were quantified.
References
-
- Ffrench-Constant R. H., Daborn P. J. & Le Goff G. The genetics and genomics of insecticide resistance. Trends Genet 20, 163–70 (2004). - PubMed
-
- McKenzie J. A. Ecological and evolutionary aspects of insecticide resistance. (Academic Press, Austin, 1996).
-
- Liu N., Zhu F., Xu Q., Pridgeon J. W. & Zhang L. Behavioral change, physiological modification, and metabolic detoxification: mechanisms of insecticide resistance. Acta Entomologica Sinica 48, 672–680 (2006).
-
- Scott J. G. in Handbook of Pest Management in Agriculture. (ed. Pimentel D.) 663 (CRC Press, Boca Raton, 1991).
-
- Argentine J. A., Zhu K. Y., Lee S. H. & Clark J. M. Biochemical-Mechanisms of Azinphosmethyl Resistance in Isogenic Strains of Colorado Potato Beetle. Pestic Biochem Physiol 48, 63–78 (1994).
Publication types
MeSH terms
Substances
LinkOut - more resources
Full Text Sources
Other Literature Sources
Medical
