. 2013 Mar;24(4):559-72.
doi: 10.1681/ASN.2012080871. Epub 2013 Mar 14.

EphrinB2 reverse signaling protects against capillary rarefaction and fibrosis after kidney injury

Affiliations

EphrinB2 reverse signaling protects against capillary rarefaction and fibrosis after kidney injury

Yujiro Kida et al. J Am Soc Nephrol. 2013 Mar.

Abstract

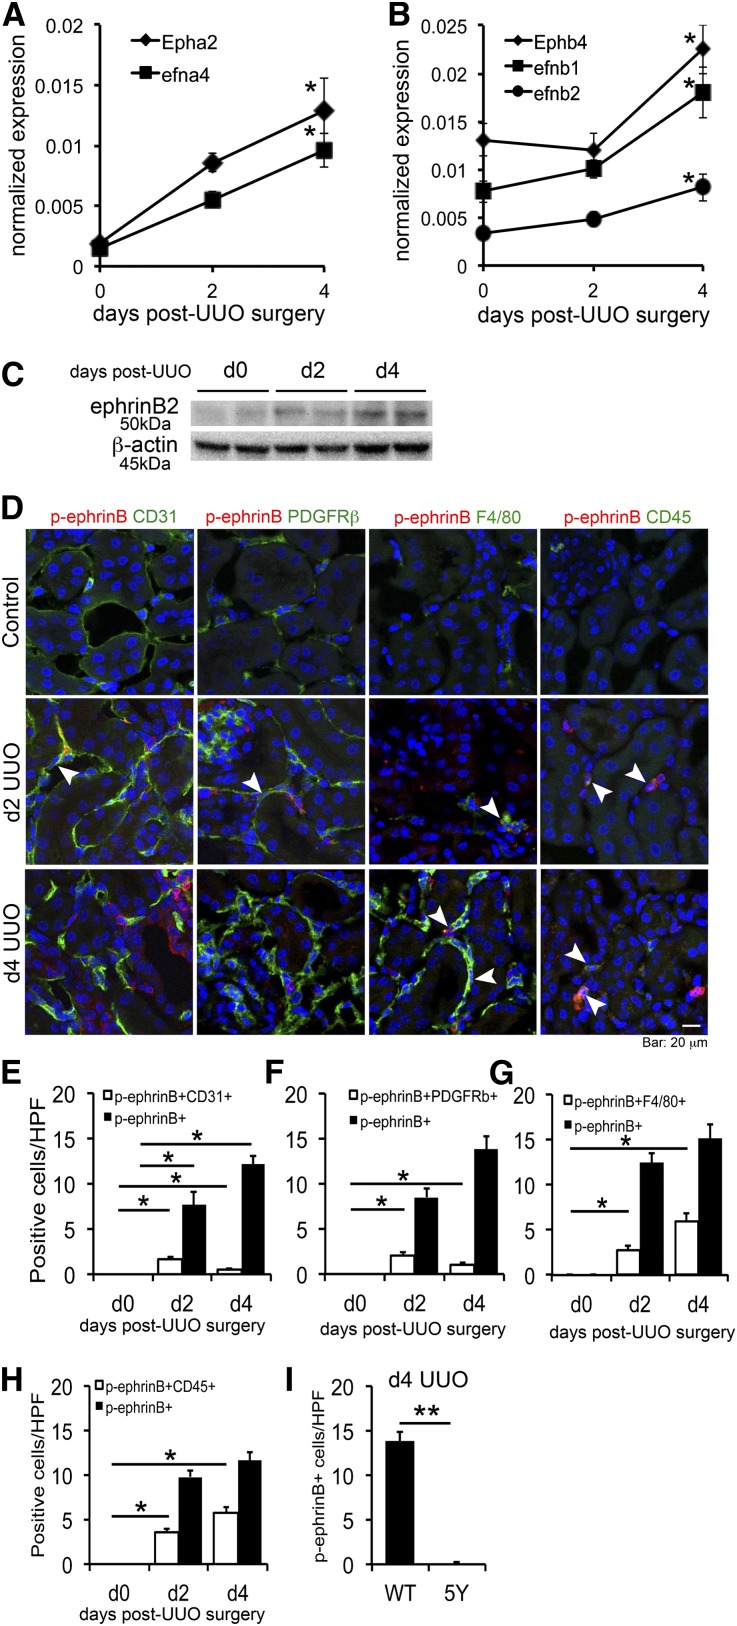
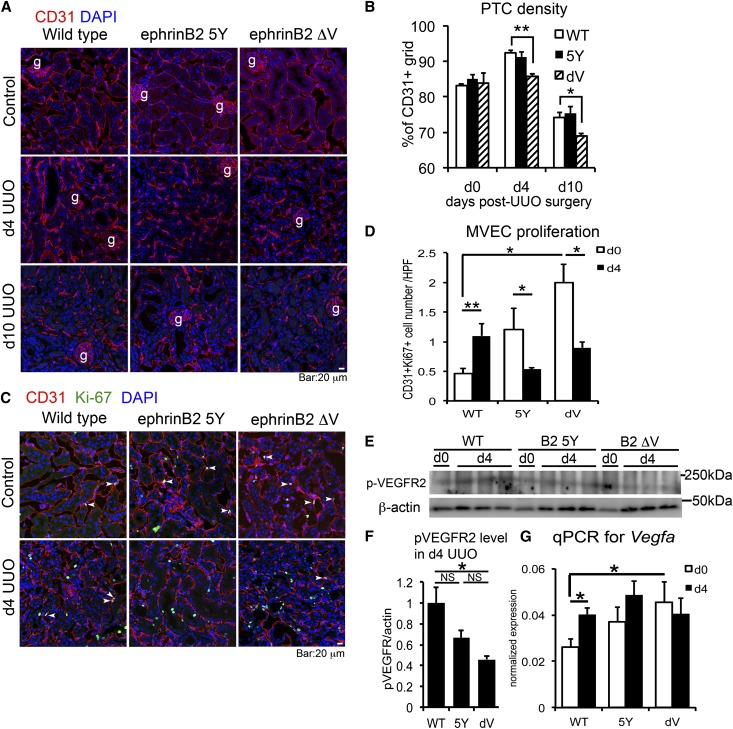
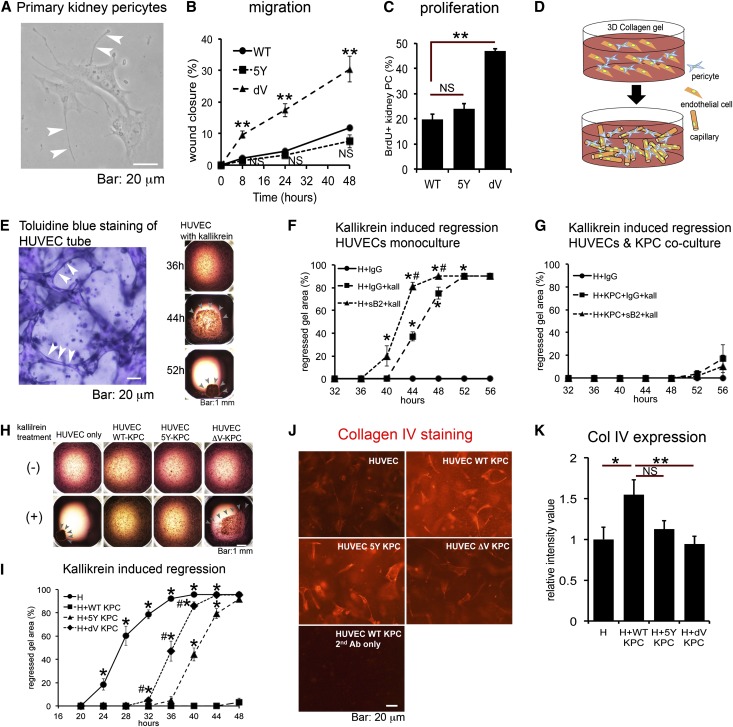
Microvascular disease, a characteristic of acute and chronic kidney diseases, leads to rarefaction of peritubular capillaries (PTCs), promoting secondary ischemic injury, which may be central to disease progression. Bidirectional signaling by EphB4 receptor and ephrinB2 ligand is critical for angiogenesis during murine development, suggesting that ephrinB2 reverse signaling may have a role in renal angiogenesis induced by injury or fibrosis. Here, we found that ephrinB2 reverse signaling is activated in the kidney only after injury. In mice lacking the PDZ intracellular signaling domain of ephrinB2 (ephrinB2 ΔV), angiogenesis was impaired and kidney injury led to increased PTC rarefaction and fibrosis. EphrinB2 ΔV primary kidney pericytes migrated more than wild-type pericytes and were less able to stabilize capillary tubes in three-dimensional culture and less able to stimulate synthesis of capillary basement membrane. EphrinB2 ΔV primary kidney microvascular endothelial cells migrated and proliferated less than wild-type microvascular endothelial cells in response to vascular endothelial growth factor A and showed less internalization and activation of vascular endothelial growth factor receptor-2. Taken together, these results suggest that PDZ domain-dependent ephrinB2 reverse signaling protects against PTC rarefaction by regulating angiogenesis and vascular stability during kidney injury. Furthermore, this signaling in kidney pericytes protects against pericyte-to-myofibroblast transition and myofibroblast activation, thereby limiting fibrogenesis.


Figures

Figure 1.
Figure 1.
Eph receptors and ephrin ligands are expressed in kidney pericytes, MVECs, and macrophages and are regulated in kidney injury. (A and B) qPCR showing time course of transcript levels of Eph/ephrin family genes that are highly expressed and regulated in whole kidney after UUO kidney injury. Expression levels are normalized to GAPDH. n=3 per time point. *P<0.05 versus d0 UUO kidney. (C) Western blot for ephrinB2 and β-actin (loading control) using whole kidney lysates from normal and UUO kidneys. Note that ephrinB2 expression is increased after UUO. (D) Double-immunofluorescence staining for p-ephrinB (red) and each cell marker (green) in control, d2, and d4 UUO kidneys. Note that control kidneys do not have any p-ephrinB+ cells. In d2 UUO kidneys, some of the CD31+ MVECs or PDGFRβ+ pericytes express p-ephrinB. In d4 UUO kidneys, the major population of p-ephrinB+ cells is composed of F4/80+ macrophages and CD45+ leukocytes. Arrowheads indicate double-positive cells. (E–H) Quantification of p-ephrinB+ cell number in specific cell populations. (E) Quantification of p-ephrinB+ CD31+ MVECs. The number of double-positive cells peaks in d2 UUO. (F) Quantification of p-ephrinB+ PDGFRβ+ pericytes. The number of double-positive cells peaks in d2 UUO. (G) Quantification of p-ephrinB+ F4/80+ macrophages. The number of double-positive cells progressively increases after UUO kidney injury. (H) Quantification of p-ephrinB+ CD45+ leukocytes. The number of double-positive cells progressively increases after UUO kidney injury. (I) The number of p-ephrinB+ cells in d4 UUO kidneys of WT and ephrinB2 5Y (5Y) mice. Note that no p-ephrinB+ cells are detected in 5Y mice. *P<0.05; **P<0.01. Scale bar, 20 μm.
Figure 2.
Figure 2.
Defective PDZ-dependent ephrinB2 signaling promotes progressive capillary rarefaction and impairs angiogenesis after UUO kidney injury. (A) Immunofluorescence images of CD31+ MVECs in control, d4, and d10 UUO kidneys of WT, ephrinB2 5Y (5Y), and ephrinB2 ΔV (dV) mice. (B) Quantification of PTC density. n=3–4 per group per time point. (C) Immunofluorescence images of CD31+ Ki-67+ proliferative MVECs in control and d4 UUO kidneys of WT, ephrinB2 5Y, and ephrinB2 ΔV mice. Arrowheads indicate double-positive cells. (D) Quantification of CD31+ Ki-67+ proliferative MVECs. n=3 per group per time point. (E) Western blot for p-VEGFR2, β-actin in d0 (normal) and d4 UUO kidneys of WT, ephrinB2 5Y, and ephrinB2 ΔV mice. (F) The protein band intensity of p-VEGFR2 in d4 UUO kidneys assessed by densitometry. Intensity of p-VEGFR2 band is normalized by β-actin band intensity. Note that p-VEGFR2 expression is reduced in ephrinB2 ΔV compared with WT. n=3 per group. (G) qPCR showing VEGFA transcriptional level in d0 and d4 UUO kidneys of WT, ephrinB2 5Y, and ephrinB2 ΔV mice. n=3 per group. *P<0.05; **P<0.01. g, glomerulus; NS, no significant difference. Scale bar, 20 μm.
Figure 3.
Figure 3.
Kidney fibrosis is enhanced due to lack of PDZ-dependent ephrinB2 signaling. (A) Images of picrosirius red-stained control and d10 UUO kidney sections for fibrillar collagen deposition (red). (B) Morphometric quantification of fibrillar collagen in d0 (normal) and d10 UUO kidneys of WT, ephrinB2 5Y (5Y), and ephrinB2 ΔV (dV) mice. n=3–4 per group. (C) Immunofluorescence images of αSMA+ myofibroblasts in control, d4, and d10 UUO kidneys of WT, ephrinB2 5Y, and ephrinB2 ΔV mice. (D) Number of αSMA+ myofibroblasts in control and UUO kidneys of WT, ephrinB2 5Y, and ephrinB2 ΔV mice. n=3–4 per group. (E) Immunofluorescence images of αSMA+ Ki-67+ proliferative myofibroblasts in control and d10 UUO kidneys. Arrowheads indicate double-positive cells. (F) Quantification of αSMA+ Ki-67+ proliferative myofibroblasts. n=3 per group per time point. (G) qPCR of αSMA (Acta2) and collagen I, α1 (Col1a1) and collagen III, α1 (Col3a1) transcripts in control and d10 UUO kidneys of WT, ephrinB2 5Y, and ephrinB2 ΔV mice. n=3–4 per group per time point. *P<0.05; **P<0.01. NS, no significant difference; g, glomerulus; a, arteriole. Scale bar, 20 μm.
Figure 4.
Figure 4.
Defective PDZ-dependent ephrinB2 signaling induces more migratory and proliferative characteristics in kidney pericytes and compromises the pericyte mediated-vascular stabilizing functions. (A) Phase contrast image of primary kidney pericytes. Arrowheads indicate extended processes. (B) Migration assay under TGF-β stimulation (10 ng/ml) using kidney pericytes isolated from WT, ephrinB2 5Y (5Y), and ephrinB2 ΔV (dV) mice. Migration of kidney pericytes was assessed by the percentage of scratch wound closure. Creation of wound in monolayer of primary kidney pericytes denotes time zero. n=6/group. **P<0.01 versus WT. (C) Proliferation assay under TGF-β stimulation (10 ng/ml) using kidney pericytes assessed by BrdU incorporation for 24 hours. n=3 per group. **P<0.01. (D) Schematic of coculture of ECs (orange) with pericytes (blue) in 3D collagen gel in wells where ECs spontaneously form endothelial capillary tubes. Addition of pericytes to this assay permits migration and binding of pericytes to capillary tubes. (E) The left panel is a toluidine blue-stained gel showing capillary tubes (arrowheads) within the gel. The right panel shows representative images of gel regression in monoculture of HUVECs stimulated with kallikrein. Indicated time shows hours after kallikrein treatment. Note that, under kallikrein stimulation, HUVEC tubes start to regress, leading to progressive gel collapse. Arrowheads indicate the remaining gel. (F) Blocking ephrinB2 reverse signaling in monoculture of HUVEC (H) in 3D gel using soluble ephrinB2-Fc. Addition of ephrinB2-Fc (sB2, 10 μg/ml) to kallikrein (kall, 1 μg/ml) accelerates gel collapse compared with kallikrein plus control IgG. n=10 per condition. *P<0.05 versus H+IgG. #P<0.05 versus H+IgG+kall. (G) Blocking ephrinB2 reverse signaling in coculture of HUVEC with WT kidney pericytes (KPCs) in 3D gel using soluble ephrinB2-Fc (sB2). Kallikrein (kall) concentration is 1 μg/ml, n=10 per condition. Note that pericytes nearly completely inhibit kallikrein induced-gel collapse even in the presence of ephrinB2-Fc. Experiments in F and G were performed simultaneously. (H) Representative images of gels under indicated culture conditions at the 36-hour time point. Note that under kallikrein stimulation, gel collapse starts at the 36-hour point in wells of HUVEC with ephrinB2 ΔV kidney pericytes (ΔV-KPC), but not in the wells of HUVEC with WT kidney pericytes (WT-KPC) or HUVEC with ephrinB2 5Y kidney pericytes (5Y-KPC). Arrowheads indicate remaining gel. Bar: 1 mm. (I) Time course of gel collapse in indicated culture conditions. Note ephrinB2 ΔV kidney pericytes (dV-KPC) demonstrate remarkably impaired vascular stabilizing functions compared with WT kidney pericytes (WT-KPC). Kallikrein concentration is 2 μg/ml, n≥20 per condition. *P<0.05 versus HUVEC+WT-KPC; #P<0.05 versus HUVEC+5Y-KPC. (J) Representative images of 3D gel stained for human type IV collagen (red). (K) Quantification of type IV collagen expression by measurement of fluorescence intensity. n=10 per condition. *P<0.05; **P<0.01. NS, no significant difference. Scale bar, 20 μm in A, E (left panel), and J; 1 mm in E (right panel) and H.
Figure 5.
Figure 5.
Defective PDZ-dependent signaling of ephrinB2 results in impaired migration and proliferation of kidney MVECs and compromises internalization and phosphorylation of VEGFR2. (A) Phase contrast and immunofluorescence images of primary kidney MVECs. Sorted and cultured MVECs express CD31 (marker for ECs) but not E-cadherin (marker for epithelial cell) and CD11b (marker for monocyte/macrophage). (B) Migration assay in response to mouse VEGF stimulation (10 ng/ml) using kidney MVECs isolated from WT, ephrinB2 5Y (5Y), and ephrinB2 ΔV (dV) mice. Migration is assessed by the percentage of wound closure. Creation of wound in monolayer of cells denotes time zero. n=3 per group. *P<0.05 versus WT; **P<0.01 versus WT; #P<0.05 versus 5Y. (C) Proliferation assay in response to mouse VEGF stimulation (10 ng/ml) using kidney MVECs assessed by BrdU incorporation for 24 h. n=3 per group. **P<0.01. (D) The left panel shows representative fluorescence images of individual kidney MVECs which indicate the distribution of VEGFR2 in response to VEGFA (100 ng/ml) for 30 minutes. The right panel indicates the proportion of internalized (red) compared with surface (green) VEGFR2 based on fluorescence intensities. n≥20 per condition. **P<0.01. (E) The left panel shows representative kidney MVECs stained for p-VEGFR2 at tyrosine 1175 (red) in control conditions or with VEGF (100 ng/ml) stimulation for 30 minutes. The right panel indicates the proportion of phosphorylated compared with total VEGFR2 based on fluorescence intensities. The ratio of p-VEGFR2 to total VEGFR2 is normalized to the values of WT group. n=20 per condition. ** P<0.01. NS, no significant difference. Scale bar, 20 μm in A; 10 μm in D and E.

Comment in

References

    1. Basile DP: Rarefaction of peritubular capillaries following ischemic acute renal failure: A potential factor predisposing to progressive nephropathy. Curr Opin Nephrol Hypertens 13: 1–7, 2004 - PubMed
    1. Eardley KS, Kubal C, Zehnder D, Quinkler M, Lepenies J, Savage CO, Howie AJ, Kaur K, Cooper MS, Adu D, Cockwell P: The role of capillary density, macrophage infiltration and interstitial scarring in the pathogenesis of human chronic kidney disease. Kidney Int 74: 495–504, 2008 - PubMed
    1. Steegh FM, Gelens MA, Nieman FH, van Hooff JP, Cleutjens JP, van Suylen RJ, Daemen MJ, van Heurn EL, Christiaans MH, Peutz-Kootstra CJ: Early loss of peritubular capillaries after kidney transplantation. J Am Soc Nephrol 22: 1024–1029, 2011 - PMC - PubMed
    1. Lin SL, Chang FC, Schrimpf C, Chen YT, Wu CF, Wu VC, Chiang WC, Kuhnert F, Kuo CJ, Chen YM, Wu KD, Tsai TJ, Duffield JS: Targeting endothelium-pericyte cross talk by inhibiting VEGF receptor signaling attenuates kidney microvascular rarefaction and fibrosis. Am J Pathol 178: 911–923, 2011 - PMC - PubMed
    1. Schrimpf C, Xin C, Campanholle G, Gill SE, Stallcup W, Lin SL, Davis GE, Gharib SA, Humphreys BD, Duffield JS: Pericyte TIMP3 and ADAMTS1 modulate vascular stability after kidney injury. J Am Soc Nephrol 23: 868–883, 2012 - PMC - PubMed

Publication types