

Elevated TNFR1 and serotonin in bone metastasis are correlated with poor survival following bone metastasis diagnosis for both carcinoma and sarcoma primary tumors
- PMID: 23493346
- PMCID: PMC3644003
- DOI: 10.1158/1078-0432.CCR-12-3416
Elevated TNFR1 and serotonin in bone metastasis are correlated with poor survival following bone metastasis diagnosis for both carcinoma and sarcoma primary tumors
Abstract
Purpose: There is an urgent need for therapies that will reduce the mortality of patients with bone metastasis. In this study, we profiled the protein signal pathway networks of the human bone metastasis microenvironment. The goal was to identify sets of interacting proteins that correlate with survival time following the first diagnosis of bone metastasis.
Experimental design: Using Reverse Phase Protein Microarray technology, we measured the expression of 88 end points in the bone microenvironment of 159 bone metastasis tissue samples derived from patients with primary carcinomas and sarcomas.
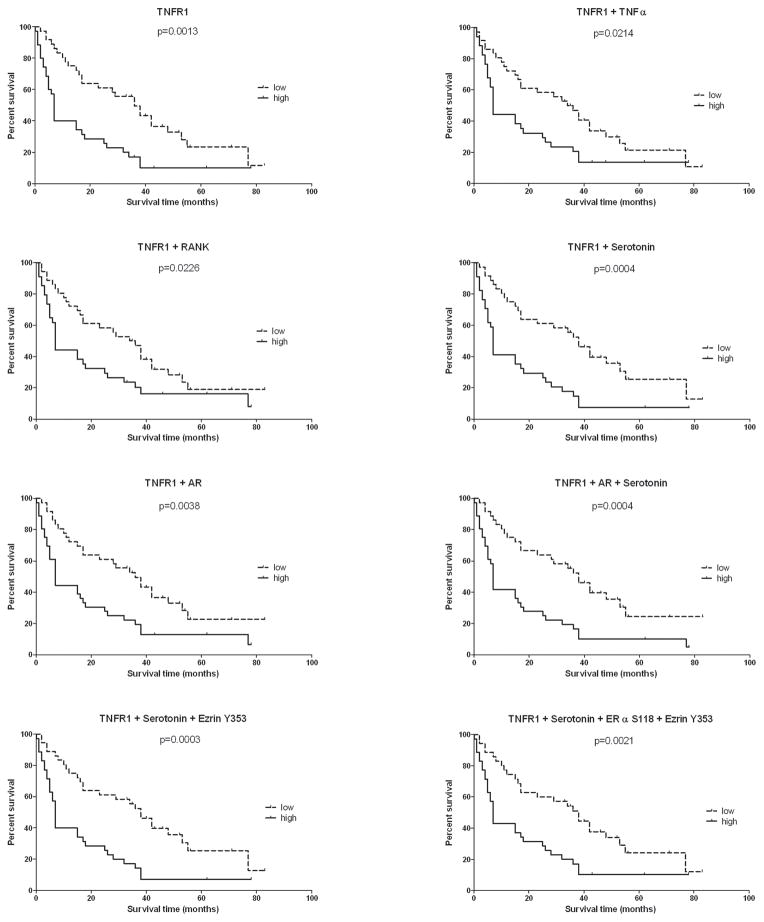
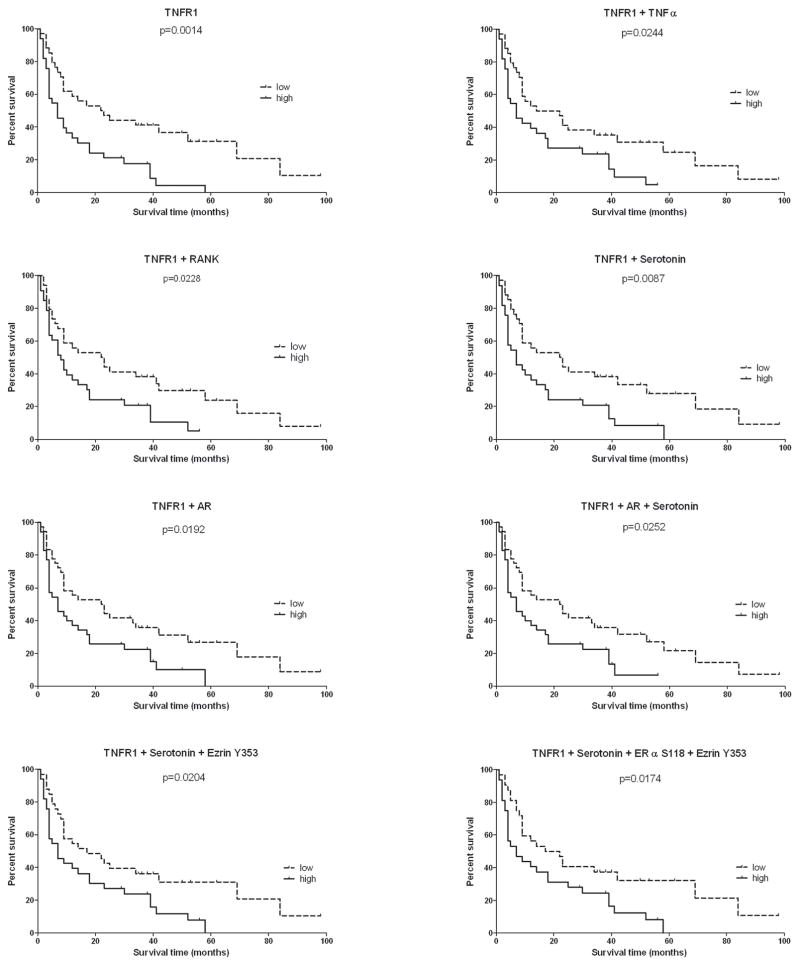
Results: Metastases originating from different primary tumors showed similar levels of cell signaling across tissue types for the majority of proteins analyzed, suggesting that the bone microenvironment strongly influences the metastatic tumor signaling profiles. In a training set (72 samples), TNF receptor 1, alone (P = 0.0013) or combined with serotonin (P = 0.0004), TNFα (P = 0.0214), and RANK (P = 0.0226), was associated with poor survival, regardless of the primary tumor of origin. Results were confirmed by (i) analysis of an independent validation set (71 samples) and (ii) independent bioinformatic analysis using a support vector machine learning model. Spearman rho analysis revealed a highly significant number of interactions intersecting with ERα S118, serotonin, TNFα, RANKL, and matrix metalloproteinase in the bone metastasis signaling network, regardless of the primary tumor. The interaction network pattern was significantly different in the short versus long survivors.
Conclusions: TNF receptor 1 and neuroendocrine-regulated protein signal pathways seem to play an important role in bone metastasis and may constitute a novel drug-targetable mechanism of seed-soil cross talk in bone metastasis.
©2013 AACR.
Conflict of interest statement
No conflict of interest to disclose.
Figures


Similar articles
-
Mapping protein signal pathway interaction in sarcoma bone metastasis: linkage between rank, metalloproteinases turnover and growth factor signaling pathways.Clin Exp Metastasis. 2014 Jan;31(1):15-24. doi: 10.1007/s10585-013-9605-6. Epub 2013 Jul 23. Clin Exp Metastasis. 2014. PMID: 23877430
-
Receptor activator for nuclear factor κ B expression predicts poor prognosis in breast cancer patients with bone metastasis but not in patients with visceral metastasis.J Clin Pathol. 2012 Jan;65(1):36-40. doi: 10.1136/jclinpath-2011-200312. Epub 2011 Nov 2. J Clin Pathol. 2012. PMID: 22049226
-
Can a Bayesian Belief Network Be Used to Estimate 1-year Survival in Patients With Bone Sarcomas?Clin Orthop Relat Res. 2017 Jun;475(6):1681-1689. doi: 10.1007/s11999-017-5346-1. Epub 2017 Apr 10. Clin Orthop Relat Res. 2017. PMID: 28397168 Free PMC article.
-
Bone Microenvironment and Osteosarcoma Metastasis.Int J Mol Sci. 2020 Sep 23;21(19):6985. doi: 10.3390/ijms21196985. Int J Mol Sci. 2020. PMID: 32977425 Free PMC article. Review.
-
Cell and Signal Components of the Microenvironment of Bone Metastasis Are Affected by Hypoxia.Int J Mol Sci. 2016 May 11;17(5):706. doi: 10.3390/ijms17050706. Int J Mol Sci. 2016. PMID: 27187355 Free PMC article. Review.
Cited by
-
Laser Capture Proteomics: spatial tissue molecular profiling from the bench to personalized medicine.Expert Rev Proteomics. 2021 Oct;18(10):845-861. doi: 10.1080/14789450.2021.1984886. Epub 2021 Dec 14. Expert Rev Proteomics. 2021. PMID: 34607525 Free PMC article. Review.
-
Persistent CD49d engagement in circulating CLL cells: a role for blood-borne ligands?Leukemia. 2016 Feb;30(2):513-7. doi: 10.1038/leu.2015.149. Epub 2015 Jun 19. Leukemia. 2016. PMID: 26183532 No abstract available.
-
Translational research in diagnosis and management of soft tissue tumours.Cancer Imaging. 2016 Jun 7;16(1):13. doi: 10.1186/s40644-016-0071-7. Cancer Imaging. 2016. PMID: 27266712 Free PMC article. Review.
-
Immunocapture strategies in translational proteomics.Expert Rev Proteomics. 2016;13(1):83-98. doi: 10.1586/14789450.2016.1111141. Epub 2015 Nov 11. Expert Rev Proteomics. 2016. PMID: 26558424 Free PMC article. Review.
-
Analysis of neuroendocrine clones in NSCLCs using an immuno-guided laser-capture microdissection-based approach.Cell Rep Methods. 2022 Aug 22;2(8):100271. doi: 10.1016/j.crmeth.2022.100271. eCollection 2022 Aug 22. Cell Rep Methods. 2022. PMID: 36046628 Free PMC article.
References
-
- Jemal A, Murray T, Samuels A, Ghafoor A, Ward E, Thun MJ. Cancer statistics. CA Cancer J Clin. 2003;53:5–26. - PubMed
-
- Rubens RD. Bone Metastases– The Clinical Problem. Eur J Cancer. 1998;34:210–3. - PubMed
-
- Carducci MA, Jimeno A. Targeting bone metastasis in prostate cancer with endothelin receptor antagonists. Clin Cancer Res. 2006;12:6296s–300s. - PubMed
Publication types
MeSH terms
Substances
Grants and funding
LinkOut - more resources
Full Text Sources
Other Literature Sources
Medical
