Review
. 2013 Mar 1;4(2):246-56.
doi: 10.3945/an.112.003137.

Challenging the fructose hypothesis: new perspectives on fructose consumption and metabolism

Affiliations
Review

Challenging the fructose hypothesis: new perspectives on fructose consumption and metabolism

John S White. Adv Nutr. .

Abstract

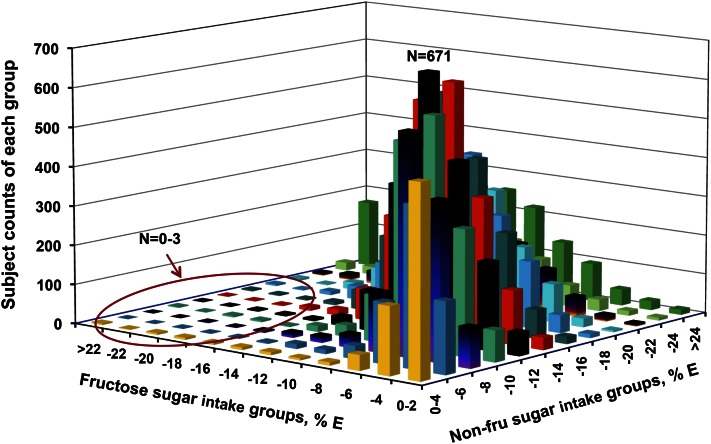
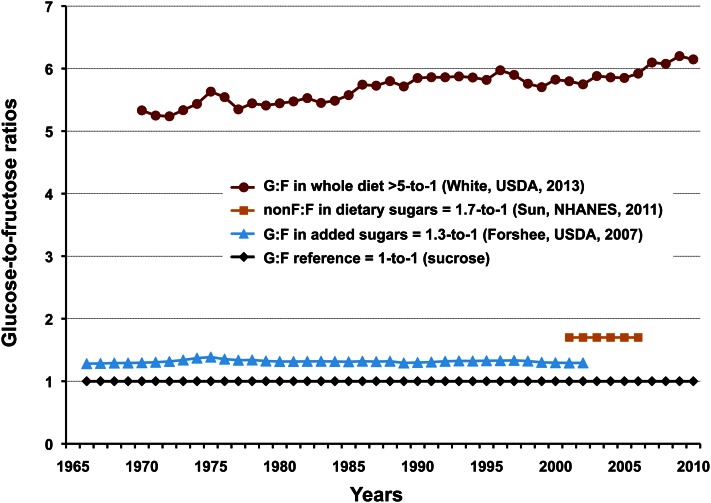
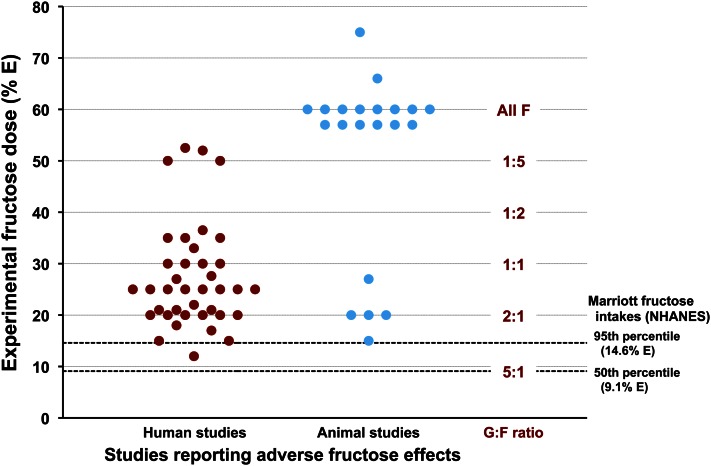
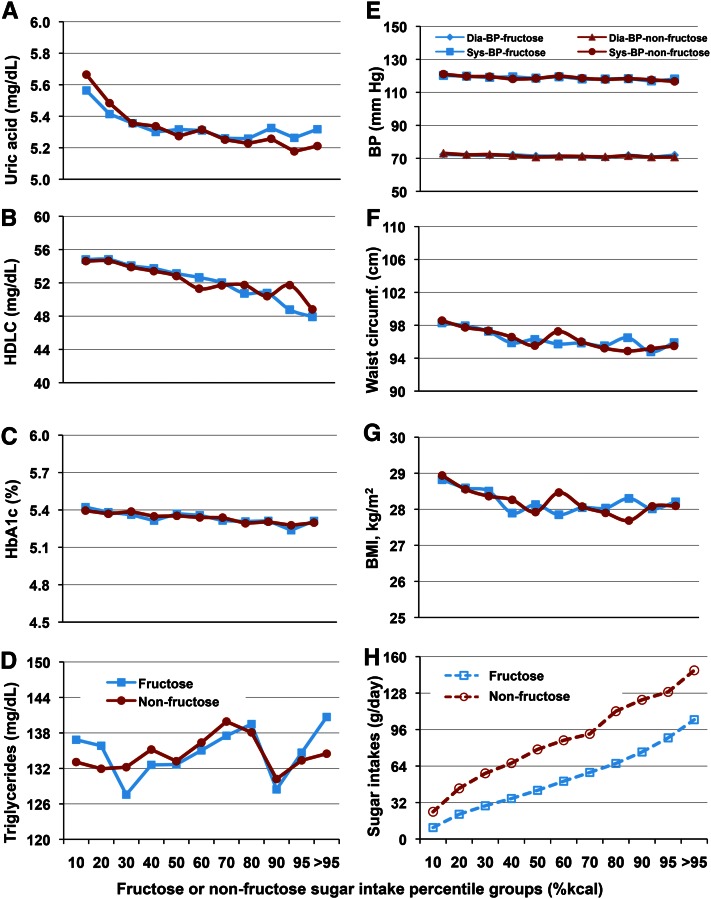
The field of sugar metabolism, and fructose metabolism in particular, has experienced a resurgence of interest in the past decade. The "fructose hypothesis" alleges that the fructose component common to all major caloric sweeteners (sucrose, high-fructose corn syrup, honey, and fruit juice concentrates) plays a unique and causative role in the increasing rates of cardiovascular disease, hypertension, diabetes, cancer, and nonalcoholic fatty liver disease. This review challenges the fructose hypothesis by comparing normal U.S. levels and patterns of fructose intake with contemporary experimental models and looking for substantive cause-and-effect evidence from real-world diets. It is concluded that 1) fructose intake at normal population levels and patterns does not cause biochemical outcomes substantially different from other dietary sugars and 2) extreme experimental models that feature hyperdosing or significantly alter the usual dietary glucose-to-fructose ratio are not predictive of typical human outcomes or useful to public health policymakers. It is recommended that granting agencies and journal editors require more physiologically relevant experimental designs and clinically important outcomes for fructose research.


Conflict of interest statement

Author disclosures: J. S. White: As a consultant and advisor to the food and beverage industry in the area of nutritive sweeteners, the author receives compensation from scientific societies, research institutes, food industry councils, trade organizations, and individual companies. Clients have an ongoing interest in nutritive sweetener research, development, production, applications, safety, nutrition, and education.

Figures

Figure 1
Figure 1
Historical trends in sucrose and high-fructose corn syrup (HFCS) consumption (availability) versus rates of obesity in adults. After significant gain in market share at the expense of sucrose, HFCS consumption has been decreasing since 1999 and there is no correlation with obesity. From USDA Economic Research Service per capita consumption data, adjusted for loss and WHO Global Database on BMI.
Figure 2
Figure 2
Commodity group energy intakes, 1970–2010. Added sugars contribution to the 449 kcal/d increase in per capita energy intake over this period was small in comparison with flour-cereal products and added fats, accounting for <8% of the increase. Added sugars intake has been decreasing since 1999. From USDA Economic Research Service average daily per capita energy from the U.S. food availability, adjusted for loss.
Figure 3
Figure 3
Historical trends in fructose and caloric sweetener consumption (availability) versus contemporary rates of obesity in adults. Despite the introduction of new caloric sweeteners, fructose intake has not substantively increased since 1920; it has been decreasing since 1999 and there is no correlation with obesity. From USDA Economic Research Service per capita consumption data, adjusted for loss and WHO Global Database on BMI.
Figure 4
Figure 4
Comparison of the fructose and glucose compositions of caloric sweeteners. Fructose and glucose are consumed together and in relatively equal amounts from high-fructose corn syrup (HFCS), sucrose, honey, and grape juice concentrate.
Figure 5
Figure 5
Sample size distribution by interaction of fructose and nonfructose (non-fru) intakes (NHANES; % kcal in adults; n = 17,749). X-axis = fructose % E (percentage of total energy), y-axis = nonfructose sugars % E, and z-axis = subject frequency (counts from 0 to 671). Fructose generally contributed less daily energy than nonfructose sugars, the ratios of fructose to nonfructose sugars were held in a fairly narrow range, and consumption of fructose or nonfructose sugar alone as the dominant sugar was uncommon in the typical American diet. For example, in the circled left-front area, the frequencies of participants who had higher fructose intakes without allied high nonfructose sugar intakes are very low (0–3 subjects for many cells). Humans consume mixtures of sugars, not fructose or glucose in isolation. % E, percentage of total energy. Reproduced with permission from (22).
Figure 6
Figure 6
Comparison of glucose-to-fructose (G:F) ratios of added sugars, dietary sugars (nonfructose to fructose), and the whole diet. Glucose is by far the dominant sugar in our food supply, exceeding fructose in the whole diet by a ratio of more than 5:1 for the past 40 y. Key provides commodity category and ratio (author, data source, publication year).
Figure 7
Figure 7
Experimental fructose dose (%E, percentage of total energy) in representative human and animal studies claiming adverse fructose effects versus Marriott’s 50th and 95th percentile fructose intake estimates. Most experimental doses exceed even the 95th percentile for human fructose intake. Few Americans consume the levels of fructose being tested, and fewer still consume these levels in the absence of glucose. Extreme dosing protocols drastically alter glucose-to-fructose (G:F) ratios and promote a distorted view of fructose metabolism.
Figure 8
Figure 8
Relationship of biochemical markers for metabolic syndrome with fructose/nonfructose sugar intakes (energy percentile) in adults, n = 8065. Solid lines connecting filled blue squares and red circles represent the biochemical markers against fructose and nonfructose, respectively, for A through G. In H, broken lines and open blue squares and red circles represent fructose and nonfructose sugars intakes in g/d, respectively, across the sugar intake percentile groups. There were no significant differences between fructose and nonfructose sugars for any of the markers and no changes in clinical importance across all intake percentiles. BP, blood pressure; HDLC, HDL cholesterol; HbA1c, glycohemoglobin. Adapted with permission from (22).

References

    1. Hallfrisch J, Reiser S, Prather ES. Blood lipid distribution of hyperinsulinemic men consuming three levels of fructose. Am J Clin Nutr. 1983;37:740–8 - PubMed
    1. Reiser S, Smith JC, Jr, Mertz W, Holbrook JT, Scholfield DJ, Powell AS, Canfield WK, Canary JJ. Indices of copper status in humans consuming a typical American diet containing either fructose or starch. Am J Clin Nutr. 1985;42:242–51 - PubMed
    1. Reaven GM. Effects of fructose on lipid metabolism. Am J Clin Nutr. 1982;35:627. - PubMed
    1. Hwang IS, Ho H, Hoffman BB, Reaven GM. Fructose-induced insulin resistance and hypertension in rats. Hypertension. 1987;10:512–6 - PubMed
    1. Introduction to the health effects of dietary fructose. Am J Clin Nutr. 1993;58:721S–823S - PubMed

MeSH terms