. 2013 Mar 26;110(13):E1212-21.
doi: 10.1073/pnas.1303094110. Epub 2013 Mar 14.

Complete and unidirectional conversion of human embryonic stem cells to trophoblast by BMP4

Affiliations

Complete and unidirectional conversion of human embryonic stem cells to trophoblast by BMP4

Mitsuyoshi Amita et al. Proc Natl Acad Sci U S A. .

Abstract

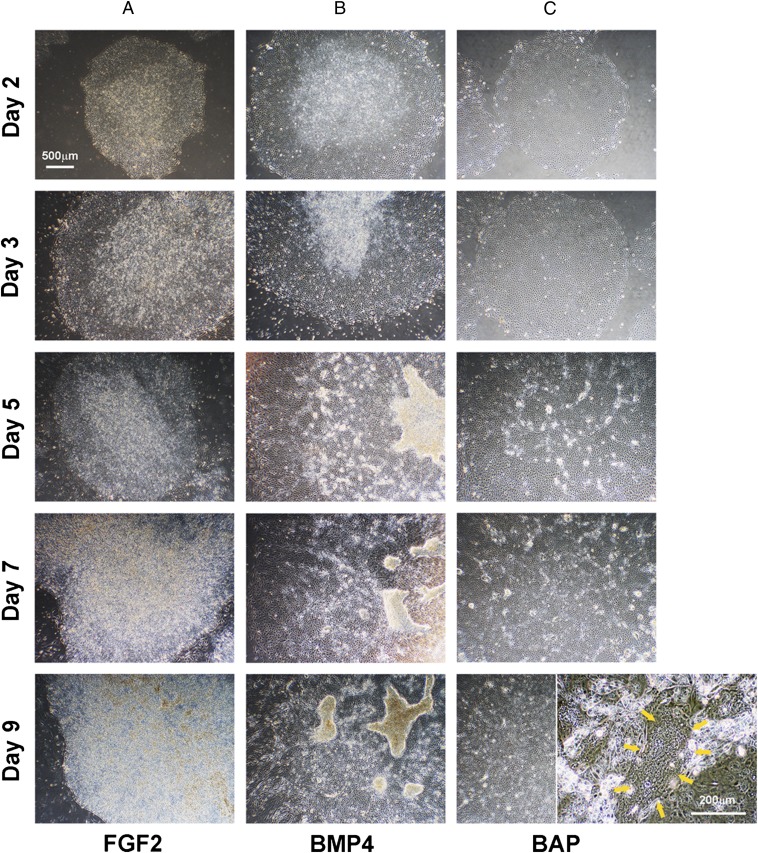
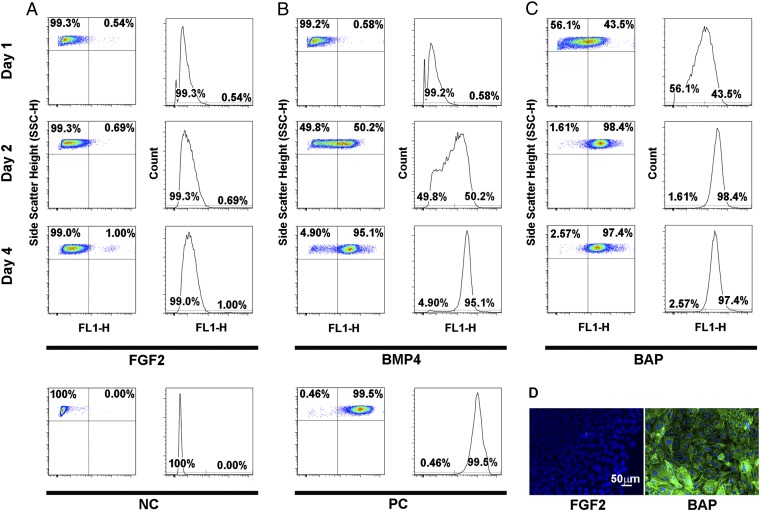
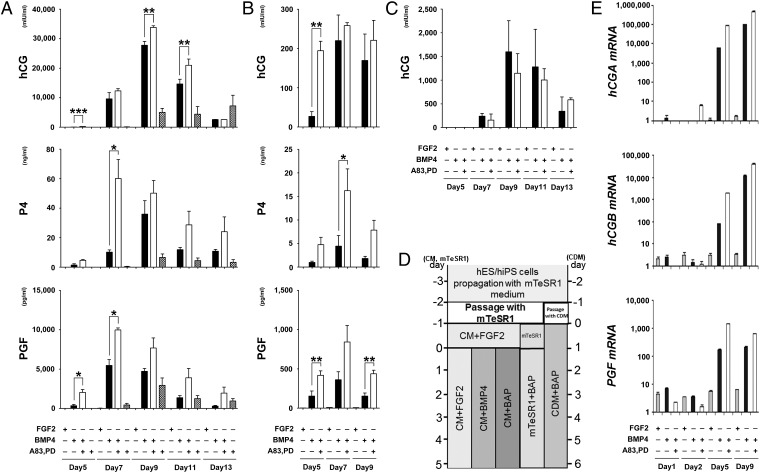
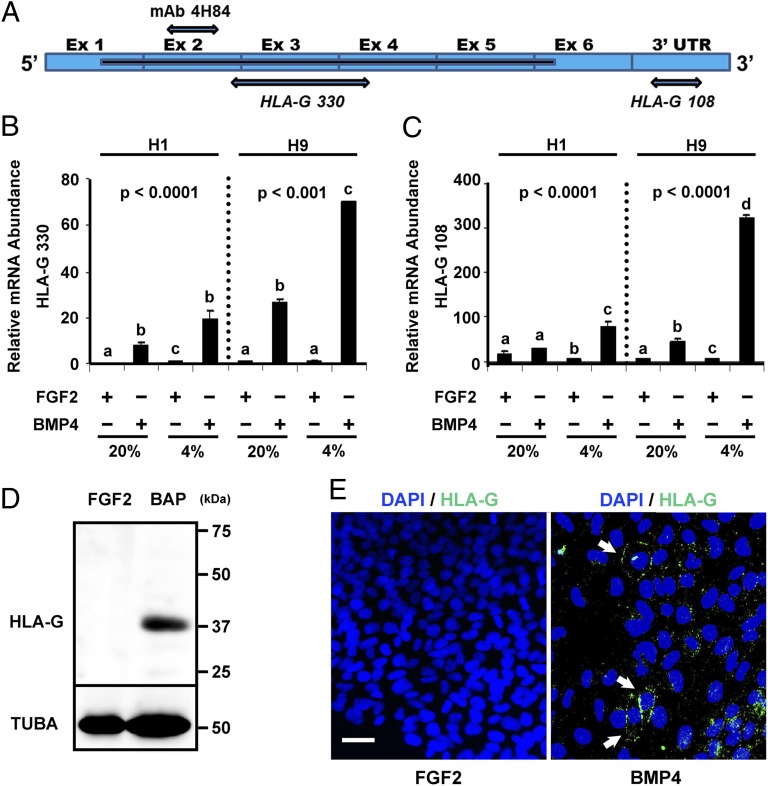
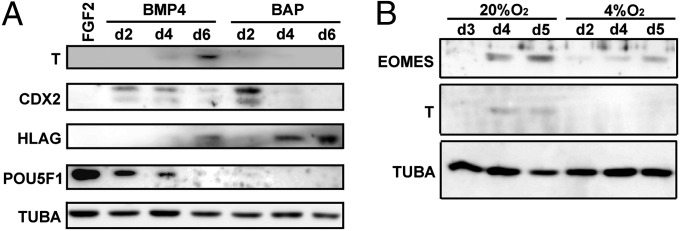
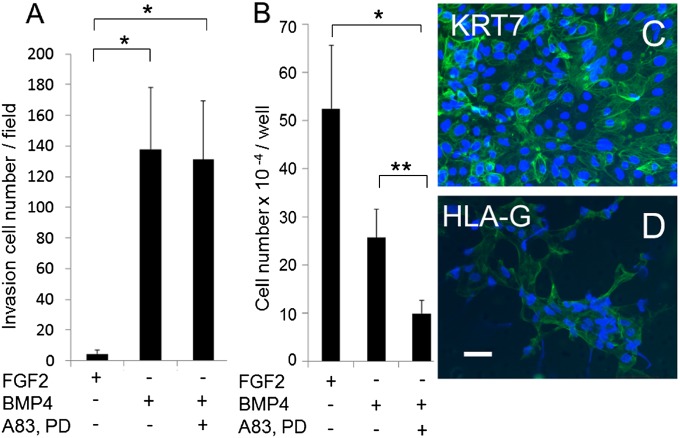
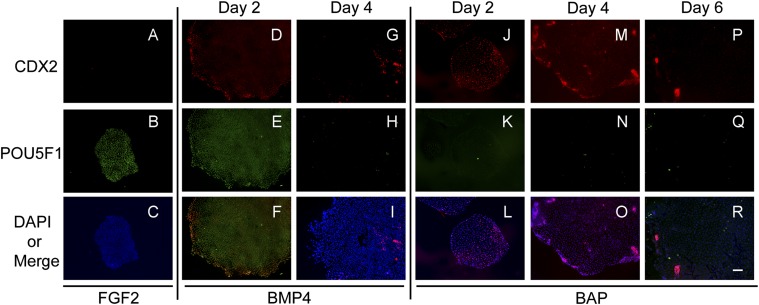
Human ES cells (hESC) exposed to bone morphogenic protein 4 (BMP4) in the absence of FGF2 have become widely used for studying trophoblast development, but the soundness of this model has been challenged by others, who concluded that differentiation was primarily toward mesoderm rather than trophoblast. Here we confirm that hESC grown under the standard conditions on a medium conditioned by mouse embryonic fibroblasts in the presence of BMP4 and absence of FGF2 on a Matrigel substratum rapidly convert to an epithelium that is largely KRT7(+) within 48 h, with minimal expression of mesoderm markers, including T (Brachyury). Instead, they begin to express a series of trophoblast markers, including HLA-G, demonstrate invasive properties that are independent of the continued presence of BMP4 in the medium, and, over time, produce extensive amounts of human chorionic gonadotropin, progesterone, placental growth factor, and placental lactogen. This process of differentiation is not dependent on conditioning of the medium by mouse embryonic fibroblasts and is accelerated in the presence of inhibitors of Activin and FGF2 signaling, which at day 2 provide colonies that are entirely KRT7(+) and in which the majority of cells are transiently CDX2(+). Colonies grown on two chemically defined media, including the one in which BMP4 was reported to drive mesoderm formation, also differentiate at least partially to trophoblast in response to BMP4. The experiments demonstrate that the in vitro BMP4/hESC model is valid for studying the emergence and differentiation of trophoblasts.


Conflict of interest statement

The authors declare no conflict of interest.

Figures

Fig. 1.
Fig. 1.
Temporal changes in colony morphologies of H1 ESC in response to culture conditions. (A) Colonies cultured under standard conditions (MEF-CM) in the presence of 4 ng/mL FGF2 and in the absence of BMP4. (B) Colonies cultured under standard conditions (MEF-CM) in the presence of 10 ng/mL BMP4 and the absence of FGF2. (C) Colonies cultured under standard conditions (MEF-CM) in the presence of BMP4 and the inhibitors A83-01 and PD173074 (BMP4/A/P conditions; BAP). (C) An area of syncytium, which begins to appear around day 7 after BMP4 and BMP4/A/P treatment, is shown in the right side of the day 9 BAP panel. (Arrows delineate the boundary of the syncytium. (Scale bars: 500 μm for AC and 200 μm in BAP day 9 Inset.)
Fig. 2.
Fig. 2.
Flow cytometry histograms for KRT7 expression in H1 hESC. Colonies were cultured in MEF-CM containing FGF2 (A), BMP4 (B), or BMP4/A/P (BAP) (C) for 1, 2, or 4 d. Cells were fully dispersed, fixed, and immunostained for either KRT7 or α-tubulin (TUBA) as positive control (PC). For the negative control (NC) cells were exposed only to second antibody without prior exposure to primary KRT7 and TUBA antibodies. (D) KRT7 immunostaining of H1 colonies cultured under control conditions (MEF-CM) with FGF2 (Left) and with BMP4/A/P (BAP) (Right) for 8 d. The nuclei were counterstained with DAPI (blue). (Scale bar: 50 µm.)
Fig. 3.
Fig. 3.
Daily accumulation and expression of placental hormones by H1 hESC under different culture conditions. (A) Changes in production of hCG, P4, and PGF from cells cultured in MEF-CM supplemented with FGF2 (values are too small to be shown), BMP4 (black bars), BMP4/A/P (BAP; white bars), and A/P (checkered bars). The medium in each culture dish was replaced daily and measured by ELISA. (B) Comparable measurements from cells cultured in CDM and on a gelatin-coated substratum. In the BMP4 (black bars) and BMP4/A/P (white bars) conditions, the medium lacked FGF2/Activin. (C) Comparable measurements from cells cultured in mTeSR1 medium. In the BMP4 (black bars) and BMP4/A/P (white bars) conditions, the medium lacked FGF2/TGF-β. *P < 0.05, **P < 0.01, ***P < 0.001. (D) Cartoon showing the experimental design used for all three culture media. (E) qRT-PCR for CGA, CGB, and PGF mRNA expression in H1 hESC at days 1, 2, 5, and 9 in cells cultured with MEF-CM supplemented with FGF2 (gray bars), BMP4, (black bars), BMP4/A/P (BAP; open bars). Relative mRNA abundances are shown on a log10 scale on the y axis. Selection of control values and the normalization procedures are described in SI Materials and Method. The threshold cycle (CT) and ΔCT values of CGA, CGB, and PGF are shown in Table S1. Increases for CGA, CGB, and PGF over time in the BMP4 and BMP4/A/P conditions were highly significant (P < 0.0001 for CGA and CGB; P = 0.0013 for PGF); changes in transcript concentrations for all three genes after culture on FGF2-supplemented medium did not change significantly over time. At days 5 and 9, CGA, CGB, and PGF transcript concentrations were higher (P < 0.0001) in BMP4/A/P (BAP) conditions than in BMP4 conditions.
Fig. 4.
Fig. 4.
HLA-G gene expression in hESC under different culture conditions. (A) Cartoon representing the full-length HLA-G transcript with boundaries of exons 1–6. Its protein-coding region is shown as a thick bar, amd the region encoding the epitope for the monoclonal antibody (mAB) 4H84 and the region of the mRNA amplified by qRT-PCR in B and C are shown as arrows. (B and C) qRT-PCR of a region derived between exons 2 and 4 of the HLA-G transcript (HLA-G 330) (B) or the 3 UTR HLA-G 108 (C) present in H1 (Left) and H9 (Right) hESC cultured under low (4%) or high (20%) O2 conditions in MEF-CM with FGF2 or in MEF-CM with BMP4 and without FGF2. Relative mRNA abundances are shown on a log10 y-axis scale (SI Materials and Method). Different letters indicate bars with significantly different values (P < 0.001). (D) HLA-G expression in H1 hESC before and after TR differentiation: HLA-G (∼40 kDa) was detected in lysates from BMP4/A/P-treated hESC (Right Lane) but not from undifferentiated cells (FGF2) (Left Lane) by Western blots incubated with 4H84 monoclonal antibody. The loading control was TUBA (50 kDa). (E) H1 hESC immunostained for HLA-G and DAPI (to stain nuclear material) after 48-h treatment with BMP4 (Right) or with FGF2 (Left) under high O2 conditions. Green fluorescence, mainly confined to the periphery of cells, indicates HLA-G. (Scale bar: 50 µm.)
Fig. 5.
Fig. 5.
Western blot analysis of lysates from H1 hESC cultured in MEF-CM with BMP4 or BMP4/A/P under 20% or 4% O2 conditions. (A) Cells cultured with FGF2 (lane 1) or for various time periods with BMP4 and BMP4/A/P under 20% O2 conditions. The exposure times for image capturing were 1 min for HLA-G and TUBA, 5 min for CDX2 and POU5F1, and 10 min for T. (B) Cells cultured for various time periods with BMP4 under high (20%) or low (4%) O2 conditions. For both A and B, TUBA was used as a loading control. The exposure times were 2 min for EOMES, 15 s for T, and 1 s for TUBA.
Fig. 6.
Fig. 6.
Acquisition of invasive/motility properties by H1 hESC in response to BMP4 and BMP4/A/P. H1 hESC were plated on Matrigel-coated membranes with 8-µm pores inserted into invasion chambers arranged in a six-well format at a density of 5 × 10⁴ cells per chamber. (A) After 5-d culture in MEF-CM supplemented with FGF2, BMP4, or BMP4/A/P (A83, PD), cells that had migrated through the pores and attached to the undersurface of the membranes were counted. Three independent experiments, each in duplicate, were performed for each treatment. Values are means ± SEM. Pairwise comparisons were conducted between treatments (*P < 0.05, **P < 0.01). (B) Total cell numbers per well for H1 hESC cultured for 5 d under conditions identical to those used in A. (C and D) Cells that had been cultured under BMP4/A/P conditions and that had invaded the underside of the invasion chamber membrane were immunostained for KRT7 (C) and HLA-G (D) (Scale bar: 50 μm.)
Fig. 8.
Fig. 8.
qRT PCR for CDX2, EOMES, ELF5-2b, T, and TBX4 in hESC in response to the respective culture conditions. H1 (A, C, E, G, and I) and H9 (B, D, F, H, and J) hESC were cultured on MEF-CM in the presence of FGF2 (gray bars), BMP4 in the absence of FGF2 (black bars), or BMP4/A/P (white bars) for 1, 2, 5, and 9 d. Relative mRNA abundances are shown on a log10 scale on the y axis (SI Materials and Methods, Tables S3 and S4). In H1 cells, values for CDX2 expression in BMP4 and BMP4/A/P cells were significantly higher (P < 0.05) than in controls only on day 2 and day 9. Similar changes were seen for CDX2 values in H9 cells (day 2, P < 0.005) and (day 9, P < 0.05). In H1 cells EOMES expression was greater in BMP4 than in BMP4/A/P conditions on days 1, 2, and 9 (P < 0.05). In H9 cells EOMES expression in BMP4 conditions was higher than in BMP4/A/P and control (P < 0.05) on all days. For ELF5-2b, up-regulation occurred significantly earlier in BMP4/A/P conditions than in the other two treatments (P < 0.01) in both cell lines. Values for T were not above threshold values in H1 cells under any treatment but were modestly up-regulated by BMP4 in H9 cells at day 5 only. In both cell lines TBX4 expression was significantly above background only under BMP4 conditions at day 9. Complete statistical data are available upon request.
Fig. 7.
Fig. 7.
Time course for expression of CDX2 and POU5F1 in H1 hESC cultured on MEF-CM supplemented with FGF2, BMP4, or BMP4/A/P. H1 cells were cultured on MEF-CM supplemented with FGF2 (AC), BMP4 (DI), or BMP4/A/P (JR) and were fixed on day 2, day 4, or day 6. (Top Row) Colonies immunostained for CDX2 (red). (Middle Row) Colonies stained for POU5F1 (green). (Bottom Row) The same colonies stained by DAPI and the merged fluorescent images from the two panels above. (Scale bar: 200 μm.)

References

    1. Xu RH, et al. BMP4 initiates human embryonic stem cell differentiation to trophoblast. Nat Biotechnol. 2002;20(12):1261–1264. - PubMed
    1. Golos TG, Pollastrini LM, Gerami-Naini B. Human embryonic stem cells as a model for trophoblast differentiation. Semin Reprod Med. 2006;24(5):314–321. - PubMed
    1. Zhang P, et al. Short-term BMP-4 treatment initiates mesoderm induction in human embryonic stem cells. Blood. 2008;111(4):1933–1941. - PubMed
    1. Wu Z, et al. Combinatorial signals of activin/nodal and bone morphogenic protein regulate the early lineage segregation of human embryonic stem cells. J Biol Chem. 2008;283(36):24991–25002. - PMC - PubMed
    1. Douglas GC, VandeVoort CA, Kumar P, Chang TC, Golos TG. Trophoblast stem cells: Models for investigating trophectoderm differentiation and placental development. Endocr Rev. 2009;30(3):228–240. - PMC - PubMed

Publication types

MeSH terms

Associated data