. 2013 Mar 26;110(13):4935-40.
doi: 10.1073/pnas.1213302110. Epub 2013 Mar 14.

Link between the double-Intertropical Convergence Zone problem and cloud biases over the Southern Ocean

Affiliations

Link between the double-Intertropical Convergence Zone problem and cloud biases over the Southern Ocean

Yen-Ting Hwang et al. Proc Natl Acad Sci U S A. .

Abstract

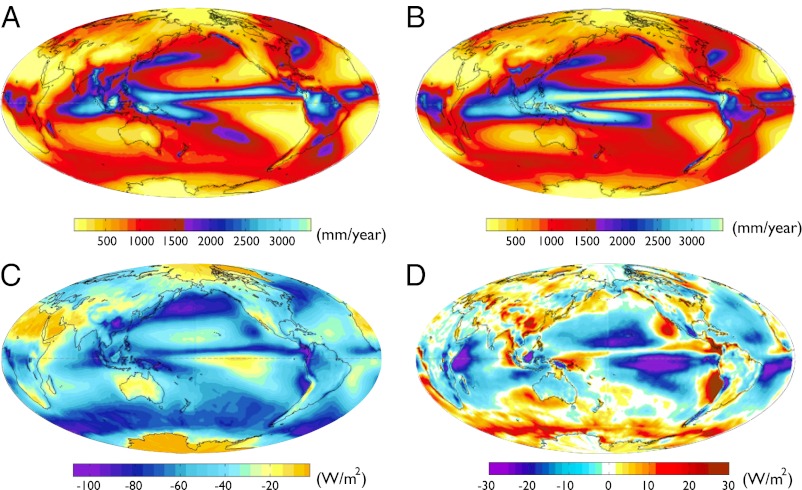
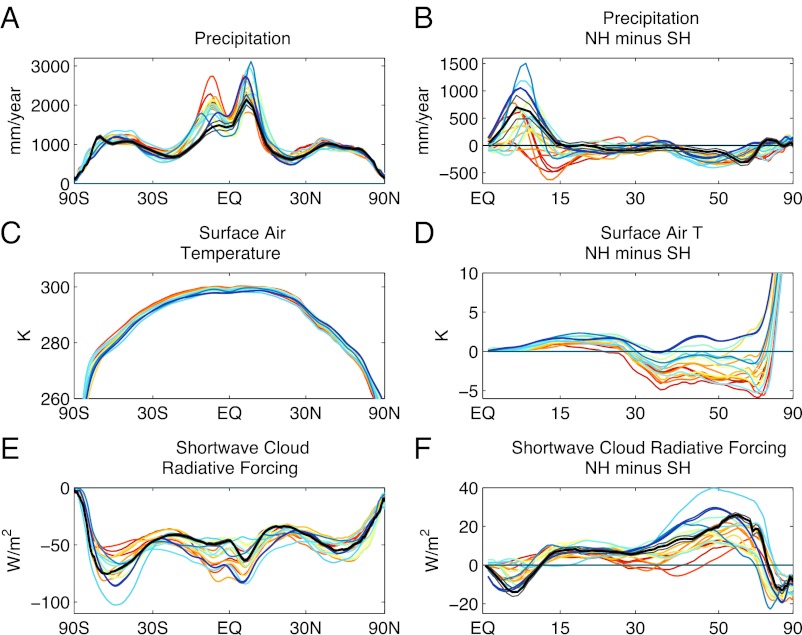
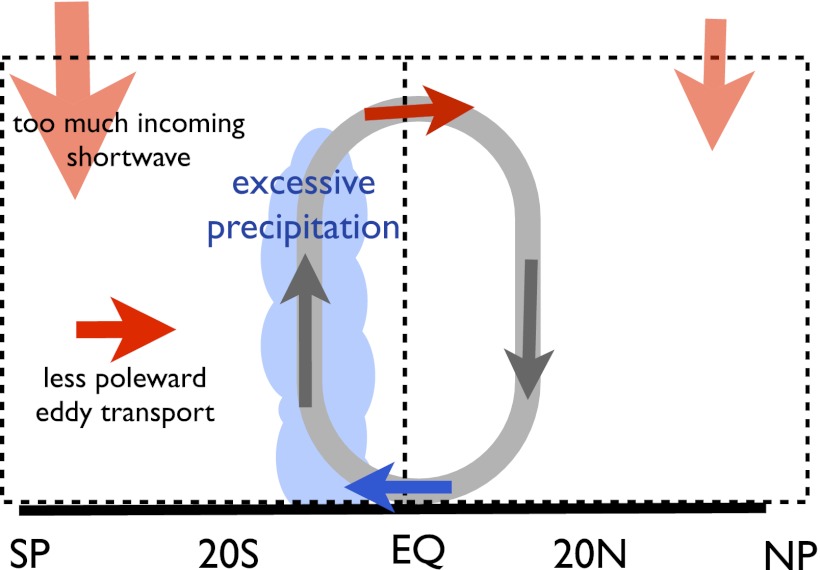
The double-Intertropical Convergence Zone (ITCZ) problem, in which excessive precipitation is produced in the Southern Hemisphere tropics, which resembles a Southern Hemisphere counterpart to the strong Northern Hemisphere ITCZ, is perhaps the most significant and most persistent bias of global climate models. In this study, we look to the extratropics for possible causes of the double-ITCZ problem by performing a global energetic analysis with historical simulations from a suite of global climate models and comparing with satellite observations of the Earth's energy budget. Our results show that models with more energy flux into the Southern Hemisphere atmosphere (at the top of the atmosphere and at the surface) tend to have a stronger double-ITCZ bias, consistent with recent theoretical studies that suggest that the ITCZ is drawn toward heating even outside the tropics. In particular, we find that cloud biases over the Southern Ocean explain most of the model-to-model differences in the amount of excessive precipitation in Southern Hemisphere tropics, and are suggested to be responsible for this aspect of the double-ITCZ problem in most global climate models.


Conflict of interest statement

The authors declare no conflict of interest.

Figures

Fig. 1.
Fig. 1.
Latitude–longitude maps of precipitation and shortwave cloud radiative forcing in observations and global climate models. Annual mean precipitation, 1985–2004 from (A) the Global Precipitation Climatology Project (GPCP), version 2.1, and (B) the ensemble mean of historical simulations of 20 CMIP5 global climate models. (C) Shortwave cloud radiative forcing from satellite observations [Cloud and the Earth’s Radiant Energy System (CERES)], 2001–2010. (D) Biases in shortwave cloud radiative forcing in the ensemble mean of historical simulations of 20 CMIP5 global climate models (departure from observations).
Fig. 2.
Fig. 2.
Zonal mean and hemispheric asymmetry of precipitation, temperature, and shortwave cloud radiative forcing. Annual mean zonal mean of (A) precipitation, (C) surface air temperature, and (E) shortwave cloud radiative forcing. (B, D, and F) The interhemispheric asymmetry (NH minus SH) of A, C, and E, respectively. Each line is colored according to the atmospheric cross-equatorial energy transport in each global climate model. The black lines are from GPCP and CERES observations. The gray lines represent the SD of year-to-year variability in observations.
Fig. 3.
Fig. 3.
Global energetic analysis of the tropical precipitation asymmetry. (A) Interhemispheric temperature asymmetry versus tropical precipitation asymmetry index. (B) Atmospheric cross-equatorial energy transport (northward transport is positive) versus tropical precipitation asymmetry index. (C) Asymmetry in extratropical shortwave cloud radiative forcing (20°N∼North Pole minus 20°S∼South Pole) versus atmospheric cross-equatorial energy transport. (D) Asymmetry in extratropical shortwave cloud radiative forcing versus tropical precipitation asymmetry index. (E) Attribution of tropical precipitation asymmetry index based on the energetic framework (Materials and Methods): from Left to Right, the hemispheric asymmetry of extratropical shortwave cloud radiative forcing (CS), longwave cloud radiative forcing (CL), the noncloud shortwave effect (NS), the noncloud longwave effect (NL), and the upward surface flux (O). Each dot is colored according to the atmospheric cross-equatorial energy transport in each global climate model (y axis in B). The open circles in A–D are from the global climate model with the largest bias in surface flux (see O term in E). The black Xs are observations. The gray lines and gray Xs represent the SD of year-to-year variability in observations. Some of the SDs are too small to be visible in the figures.
Fig. 4.
Fig. 4.
Schematic of the proposed mechanism for the double-ITCZ bias. The anomalous energy fluxes and circulation in multimodel mean relative to observations are plotted. Most models simulate too much incoming shortwave radiation over the Southern Ocean due to cloud biases, which results in anomalously high temperatures in the Southern Hemisphere midlatitudes. Similar cloud biases exist in Northern Hemisphere midlatitudes, but to a much smaller degree. The anomalous heating in the Southern Ocean is spread into the Southern Hemisphere tropics by baroclinic eddies. An anomalous Hadley circulation is induced to transport energy from the Southern Hemisphere to the Northern Hemisphere (the red arrow across the equator), and keep the tropical tropospheric temperatures relatively flat. Because water vapor is concentrated in the lower troposphere, this anomalous Hadley circulation transports moisture southward (the blue arrow across the equator), and results in excessive precipitation in Southern Hemisphere tropics. Other biases in energy fluxes at the top of the atmosphere or at the surface that have hemispheric asymmetry can also affect tropical precipitation through this mechanism.

References

    1. Mechoso CR, et al. The seasonal cycle over the tropical Pacific in coupled ocean–atmosphere general circulation models. Mon Weather Rev. 1995;123(9):2825–2838.
    1. Lin J-L. The double-ITCZ problem in IPCC AR4 coupled GCMs: Ocean–atmosphere feedback analysis. J Clim. 2007;20(18):4497–4525.
    1. Solomon S, et al. Climate Change 2007: The Physical Science Basis. Cambridge, UK: Cambridge Univ Press; 2007.
    1. Gordon CT, Rosati A, Gudgel R. Tropical sensitivity of a coupled model to specified ISCCP low clouds. J Clim. 2000;13(13):2239–2260.
    1. Large WG, Danabasoglu G. Attribution and impacts of upper-ocean biases in CCSM3. J Clim. 2006;19(11):2325–2346.

Publication types

LinkOut - more resources