. 2013 Jul;62(7):2439-49.
doi: 10.2337/db12-1747. Epub 2013 Mar 14.

X-box binding protein 1 is essential for insulin regulation of pancreatic α-cell function

Affiliations

X-box binding protein 1 is essential for insulin regulation of pancreatic α-cell function

Masaru Akiyama et al. Diabetes. 2013 Jul.

Abstract

Patients with type 2 diabetes (T2D) often exhibit hyperglucagonemia despite hyperglycemia, implicating defective α-cell function. Although endoplasmic reticulum (ER) stress has been suggested to underlie β-cell dysfunction in T2D, its role in α-cell biology remains unclear. X-box binding protein 1 (XBP1) is a transcription factor that plays a crucial role in the unfolded protein response (UPR), and its deficiency in β-cells has been reported to impair insulin secretion, leading to glucose intolerance. To evaluate the role of XBP1 in α-cells, we created complementary in vivo (α-cell-specific XBP1 knockout [αXBPKO] mice) and in vitro (stable XBP1 knockdown α-cell line [αXBPKD]) models. The αXBPKO mice exhibited glucose intolerance, mild insulin resistance, and an inability to suppress glucagon secretion after glucose stimulation. αXBPKD cells exhibited activation of inositol-requiring enzyme 1, an upstream activator of XBP1, leading to phosphorylation of Jun NH2-terminal kinase. Interestingly, insulin treatment of αXBPKD cells reduced tyrosine phosphorylation of insulin receptor substrate 1 (IRS1) (pY(896)) and phosphorylation of Akt while enhancing serine phosphorylation (pS(307)) of IRS1. Consequently, the αXBPKD cells exhibited blunted suppression of glucagon secretion after insulin treatment in the presence of high glucose. Together, these data indicate that XBP1 deficiency in pancreatic α-cells induces altered insulin signaling and dysfunctional glucagon secretion.


Figures
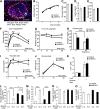
FIG. 1.
FIG. 1.
α-Cell specific deletion of XBP1 promotes glucose intolerance, insulin resistance, and hyperglucagonemia. A: Immunofluorescence staining for glucagon (red), β-gal (green), and DAPI (blue) of pancreatic sections from glucagon-Cre/ROSA26-LacZ mice. Scale bar, 100 μm. B: Body weights (n = 6–10 in each group). Nonfasting blood glucose (C), nonfasting insulin (D), and nonfasting glucagon (E) in 6-month-old male mice (n = 6 in each group). F: Intraperitoneal glucose tolerance test (ipGTT; glucose 2 g/kg body weight [BW]) in 6-month-old male mice (n = 6 in each group). G: Whole-body insulin sensitivity by insulin tolerance test (ITT; insulin 0.75 units/kg BW) in 6-month-old male mice (n = 7–11 in each group). H: Plasma glucagon levels before and after intraperitoneal glucose injection (glucose 2 g/kg BW) in 6-month-old male mice (n = 7 in each group). I: Intraperitoneal pyruvate challenge (pyruvate 2 g/kg BW) in 6-month-old male mice (n = 8–10 in each group). J: Plasma insulin levels before and after intraperitoneal glucose injection (glucose 2 g/kg BW) in 6-month-old male mice (n = 7 in each group). K: GLP-1 levels before and after oral glucose gavage (at glucose doses 1 g/kg BW; n = 3–4 in each group). Glucagon (L) and insulin secretion (M) from islets were expressed per microgram of total DNA (n = 3–4 in each group). Total glucagon (N), and total insulin (O) content of islets expressed per microgram of total DNA (n = 3–4 in each group). Data are expressed as means ± SEM. *P < 0.05, **P < 0.01, ***P < 0.001; n.s., not significant; control vs. αXBPKO.
FIG. 2.
FIG. 2.
α-Cell specific deletion of XBP1 causes ER stress but not cell death. Immunofluorescence staining (shown by grayscale) for insulin, glucagon, and somatostatin of pancreatic sections from control mice (A) and αXBPKO mice (B) at age 6 months (scale bar, 200 μm). Areas positive for insulin (C), glucagon (D), and somatostatin (E) are shown relative to total pancreas at age 6 months (n = 3 in each group) for control and αXBPKO mice. Data are expressed as means ± SEM. Ultrastructural analysis of pancreatic α-cells using electron microscopy was performed on islets from control (F) and αXBPKO (G) mice at age 6 months (scale bar, 2 μm). The magnification for the enlarged inset is × 43,860 (F) and × 32,520 (G).
FIG. 3.
FIG. 3.
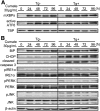
Activated IRE1α due to XBP1 deficiency leads to activation of JNK. Western blotting for spliced XBP1, active ATF6, and TBP (loading control) in control or αXBPKD cell lines (A) and in control or αXBPOE cell lines (D) before and after thapsigargin (Tg) treatment for 4 h (100 nmol/L) using nuclear fractions. Western blotting for BiP, pIRE1α, IRE1α, pPERK, PERK, pJNK, JNK, and β-actin (loading control) in control or αXBPKD cell lines (B) and in control or αXBPOE cell lines (E) before and after thapsigargin (Tg) treatment for 4 h (100 nmol/L). Quantification is shown for active ATF6/TBP, BiP/actin, pIRE1/IRE1, pPERK/PERK, and pJNK/JNK in control or αXBPKD cell lines (C) and in control or αXBPOE cell lines (F). Data are expressed as means ± SEM. *P < 0.05, **P < 0.01, ***P < 0.001. ND, not detected.
FIG. 4.
FIG. 4.
XBP1 deficiency impairs insulin signaling. Western blotting for insulin receptor (IR) tyrosine972 (Y) phosphorylation (pIR), IR, IRS1 tyrosine896 (Y) phosphorylation, IRS1 Ser307 (Ser) phosphorylation, total IRS1, Akt Thr308 phosphorylation, Akt Ser473 phosphorylation, total Akt, and β-actin (loading control) in control or αXBPKD cell lines (A) and in control or αXBPOE cell lines (D) before and after insulin (ins) treatment for 10 min (100 nmol/L). Quantification of pIRS1(Y)/IRS1, pIRS1(Ser)/IRS1, pAkt(T308)/Akt, and pAkt(S473)/Akt in control or αXBPKD cell lines (B) and in control or αXBPOE cell lines (E). Data are expressed as means ± SEM. *P < 0.05, **P < 0.01, ***P < 0.001. Glucagon secretion from control or αXBPKD cell lines (C) and control or αXBPOE cell lines (F) was assessed by static incubation for 60 min under various glucose concentrations, without or with 100 nmol/L insulin (Ins), and expressed per microgram of total DNA (n = 3–6 in each group). Data are expressed as means ± SEM. *P < 0.05, **P < 0.01; n.s., not significant.
FIG. 5.
FIG. 5.
Effects of altered XBP1 expression on [Ca2+] in αTC6 cells. The glucose (G) concentration was increased from 0.5 to 25 mmol/L, and 100 nmol/L human insulin was present as indicated. Representative traces are shown of single cells from control for KD (A), αXBPKD cell (B), control for OE (C), and αXBPOE cells (D). E: Basal [Ca2+] is shown for each group (n = 9–15 in each group). Data are expressed as means ± SEM. ***P < 0.0001. F: Quantification of frequency of spikes from each group (n = 8–16). Data are expressed as means ± SEM. *P < 0.05, **P < 0.01, ***P < 0.001; n.s., not significant.
FIG. 6.
FIG. 6.
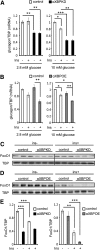
Effect of XBP1 knockdown or overexpression on glucagon gene expression. Real-time PCR of glucagon gene expression of control or αXBPKD cells (A) and control or αXBPOE cells (B) incubated at 2.8 and 10 mmol/L glucose concentration with/without 100 nmol/L insulin (Ins) for 6 h. Value were normalized by the level of TBP, and fold-changes were calculated relative to control without insulin (n = 3 in each group). Data are expressed as means ± SEM. *P < 0.05, **P < 0.01, ***P < 0.001. Western blotting for FoxO1 and TBP (loading control) in control or αXBPKD cell lines (C) and in control or αXBPOE cell lines (D) before and after insulin (ins) treatment for 3 h (100 nmol/L) using nuclear fraction. E: Quantification of FoxO1/TBP in control or αXBPKD cell lines and in control or αXBPOE cell lines before and after insulin treatment. Data are expressed as means ± SEM. **P < 0.01, ***P < 0.001.
FIG. 7.
FIG. 7.
XBP1 deficiency prevents apoptosis. αXBPKD cells (A) or αXBPOE cells (B) were plated onto 6-well plates (5 × 10⁵/well) with corresponding controls, and cells were counted on the indicated day. Data are expressed as means ± SEM (n = 4–6 in each group). Western blotting for spliced XBP1, CHOP, cleaved caspase 3, and β-actin (loading control) in control or αXBPKD cell lines (C) and in control or αXBPOE cell lines (E) before and after thapsigargin (Tg) treatment for 4 h (100 nmol/L). Quantification of CHOP/actin and cleaved caspase 3/actin in control or αXBPKD cell lines (D) and in control or αXBPOE cell lines (F). Data are expressed as means ± SEM. **P < 0.01, ***P < 0.001.
FIG. 8.
FIG. 8.
Acute induction of spliced XBP1 promotes apoptosis. Western blotting for spliced XBP1, active ATF6, and TBP (loading control) using nuclear fraction (A), and BiP, CHOP, cleaved caspase 3, pIRE1α, IRE1α, pPERK, PERK, pJNK, JNK, and β-actin (loading control) (B) in cells before and after induction of mouse spliced XBP1 by cumate (Cu, 30 μg/mL) without/with thapsigargin (Tg) treatment for 4 h (100 nmol/L). The blot is representative of independent experiments repeated three times.

References

    1. Reaven GM, Chen YD, Golay A, Swislocki AL, Jaspan JB. Documentation of hyperglucagonemia throughout the day in nonobese and obese patients with noninsulin-dependent diabetes mellitus. J Clin Endocrinol Metab 1987;64:106–110 - PubMed
    1. Unger RH, Aguilar-Parada E, Müller WA, Eisentraut AM. Studies of pancreatic alpha cell function in normal and diabetic subjects. J Clin Invest 1970;49:837–848 - PMC - PubMed
    1. Baron AD, Schaeffer L, Shragg P, Kolterman OG. Role of hyperglucagonemia in maintenance of increased rates of hepatic glucose output in type II diabetics. Diabetes 1987;36:274–283 - PubMed
    1. Ravier MA, Rutter GA. Glucose or insulin, but not zinc ions, inhibit glucagon secretion from mouse pancreatic alpha-cells. Diabetes 2005;54:1789–1797 - PubMed
    1. Gerich JE, Tsalikian E, Lorenzi M, et al. Normalization of fasting hyperglucagonemia and excessive glucagon responses to intravenous arginine in human diabetes mellitus by prolonged infusion of insulin. J Clin Endocrinol Metab 1975;41:1178–1180 - PubMed

Publication types

MeSH terms