. 2013 Mar 15;339(6125):1312-6.
doi: 10.1126/science.1233213.

Adaptive evolution of multiple traits through multiple mutations at a single gene

Affiliations

Adaptive evolution of multiple traits through multiple mutations at a single gene

Catherine R Linnen et al. Science. .

Abstract

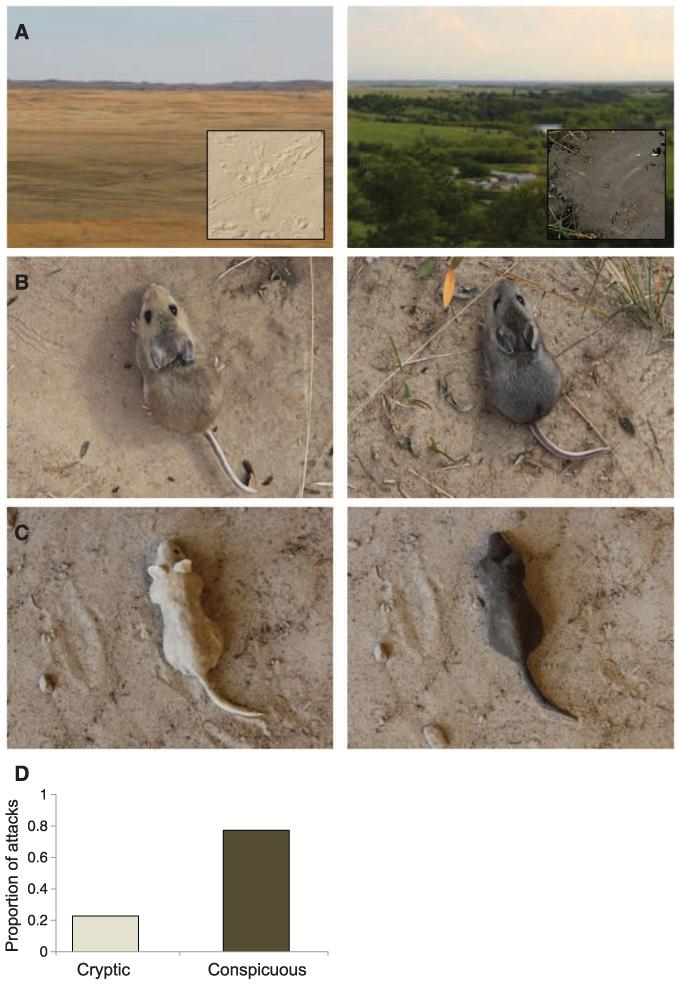
The identification of precise mutations is required for a complete understanding of the underlying molecular and evolutionary mechanisms driving adaptive phenotypic change. Using plasticine models in the field, we show that the light coat color of deer mice that recently colonized the light-colored soil of the Nebraska Sand Hills provides a strong selective advantage against visually hunting predators. Color variation in an admixed population suggests that this light Sand Hills phenotype is composed of multiple traits. We identified distinct regions within the Agouti locus associated with each color trait and found that only haplotypes associated with light trait values have evidence of selection. Thus, local adaptation is the result of independent selection on many mutations within a single locus, each with a specific effect on an adaptive phenotype, thereby minimizing pleiotropic consequences.


Figures

Fig. 1
Fig. 1
Selective advantage of crypsis against predation. (A) Typical habitat in the Sand Hills (left) and the adjacent region (right). Insets show representative substrate from each habitat. (B) Typical mouse color phenotypes from on (left) and off (right) the Sand Hills, shown on light Sand Hills substrate. (C) Typical cryptic (left) and conspicuous (right) models, shown on Sand Hills substrate. (D) Proportion of predation events occurring over 2700 model nights in the Sand Hills habitat. Conspicuous models were attacked significantly more often than cryptic models (selection index = 0.545, χ2 = 6.546, df = 1, P = 0.011).
Fig. 2
Fig. 2
The light Sand Hills phenotype is composed of multiple traits, each mapping to different regions of Agouti. (A) Typical light and dark mice. Light mice have a brighter dorsum and ventrum, an upward shift in the d-v boundary, and a decrease in the width of the tail stripe. (B) Structure of the Agouti locus with coding exons (dark boxes) and untranslated exons (light boxes). (C) Genotype-phenotype association for 466 SNPs (circles) tested in 91 mice. SNPs significant after correcting for a false discovery rate (FDR) of 5% (gray circles) and after FDR and Bonferroni correction (red circles) are shown. Gray bars highlight the position of Agouti exons. Pink bars indicate the location of candidate SNPs for each trait (). PVE by the candidate SNPs is given for each trait. All traits are significantly associated with variation in Agouti, and some traits map in or near known functional regions. Distinct patterns of association are observed for each trait.
Fig. 3
Fig. 3
Evidence of selection on light Agouti alleles. (A) Likelihood surface for all haplotypes with significance threshold [dotted line; determined by simulation ()]. (B) Likelihood surface for only light haplotypes. Arrows indicate the positions of 10 candidate polymorphisms identified by association mapping (Fig. 2), and likelihood surfaces are colored according to the haplotypes determined by the corresponding polymorphism (e.g., the red LR trace was estimated using only those chromosomes carrying the light allele at position 31327). Significance thresholds were determined separately for each data set, and only LRs that are above these thresholds are shown. Asterisks give the location of peaks identified using all haplotypes (A). (C) Twenty-kbp windows () centered on the most strongly associated polymorphism for each trait (31327, tail stripe; 77047, dorsal-ventral boundary; 111207, dorsal brightness; 118834, dorsal hue; 128150 (ΔSer), tail stripe and ventral color). Likelihood surface for dark haplotypes only (solid black line) compared with those for light haplotypes only (solid colored lines). Dotted lines are significance thresholds (black, dark only; colored, light only). (D) Strength of selection (s) is significantly correlated with PVE (R2 = 0.56; Spearman’s rho = 0.76; P = 0.0071). Color of each SNP as in (B).

References

    1. Darwin C. On the Origin of Species by Means of Natural Selection, or the Preservation of Favoured Races in the Struggle for Life. John Murray; London: 1859. - PMC - PubMed
    1. Fisher RA. The Genetical Theory of Natural Selection. Oxford Univ. Press; Oxford: 1930.
    1. Nadeau NJ, Jiggins CD. Trends Genet. 2010;26:484. - PubMed
    1. Stapley J, et al. Trends Ecol. Evol. 2010;25:705. - PubMed
    1. Hoekstra HE, Hirschmann RJ, Bundey RA, Insel PA, Crossland JP. Science. 2006;313:101. - PubMed

Publication types