Randomized Controlled Trial
. 2013 Jun 15;207(12):1817-28.
doi: 10.1093/infdis/jit099. Epub 2013 Mar 14.

The phenotype of the Cryptococcus-specific CD4+ memory T-cell response is associated with disease severity and outcome in HIV-associated cryptococcal meningitis

Affiliations
Randomized Controlled Trial

The phenotype of the Cryptococcus-specific CD4+ memory T-cell response is associated with disease severity and outcome in HIV-associated cryptococcal meningitis

Joseph N Jarvis et al. J Infect Dis. .

Abstract

Background: Correlates of immune protection in patients with human immunodeficiency virus (HIV)-associated cryptococcal meningitis are poorly defined. A clearer understanding of these immune responses is essential to inform rational development of immunotherapies.

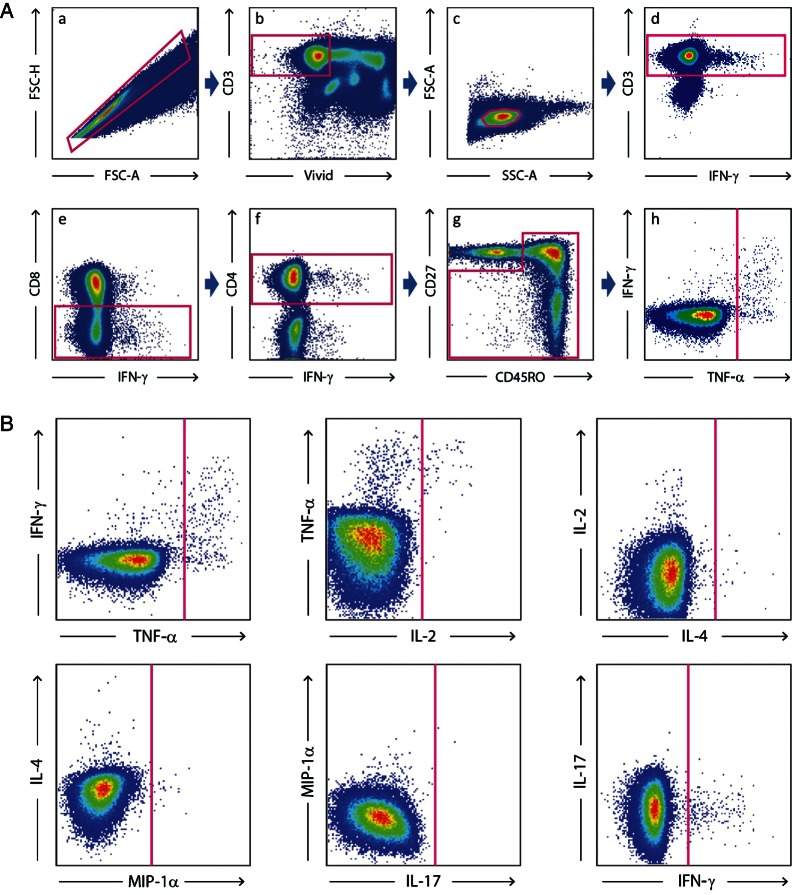
Methods: Cryptococcal-specific peripheral CD4(+) T-cell responses were measured in 44 patients with HIV-associated cryptococcal meningitis at baseline and during follow-up. Responses were assessed following ex vivo cryptococcal mannoprotein stimulation, using 13-color flow-cytometry. The relationships between cryptococcal-specific CD4(+) T-cell responses, clinical parameters at presentation, and outcome were investigated.

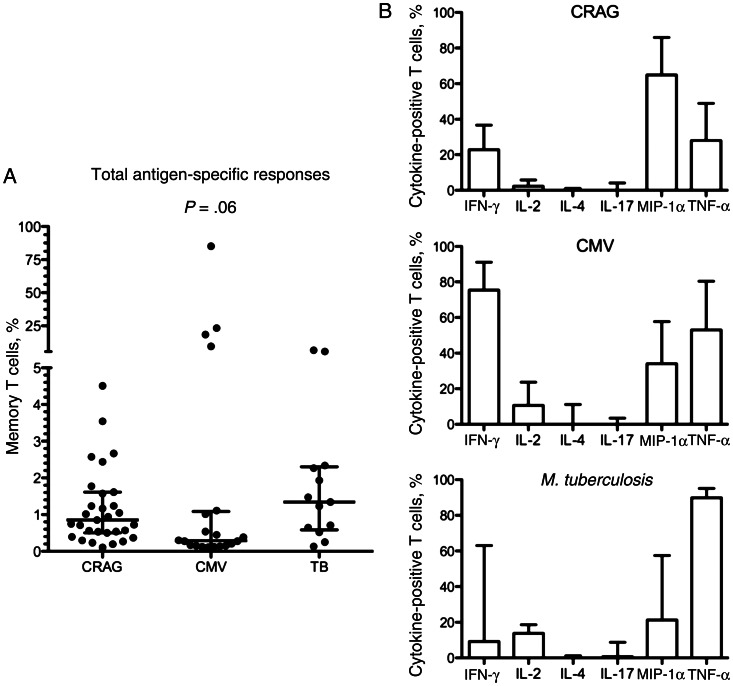
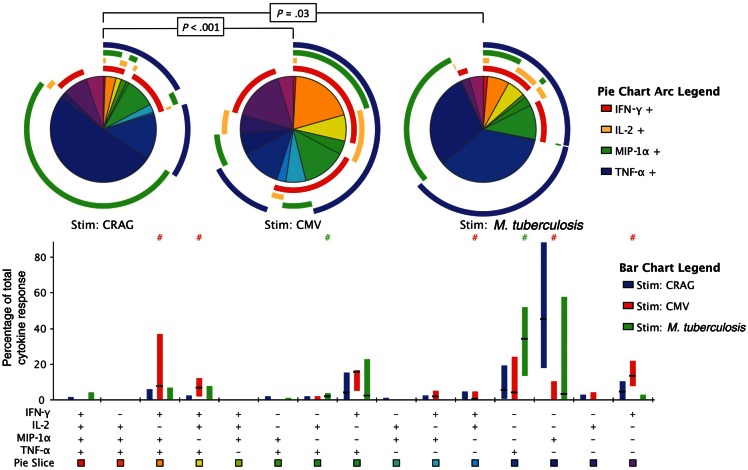
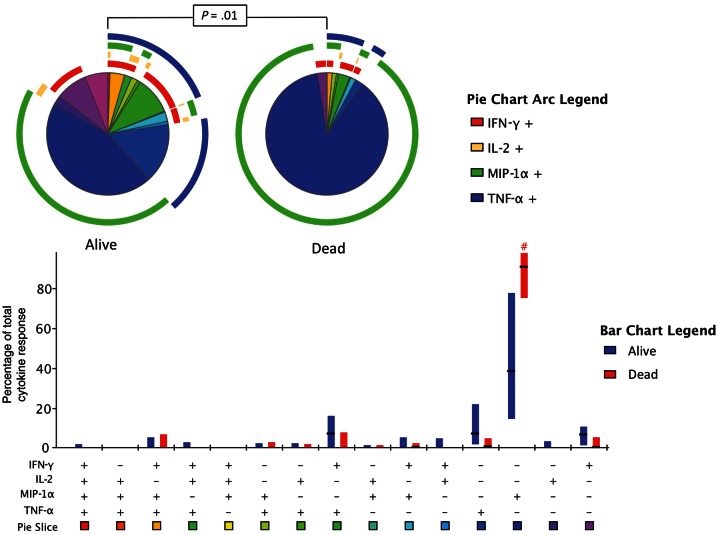
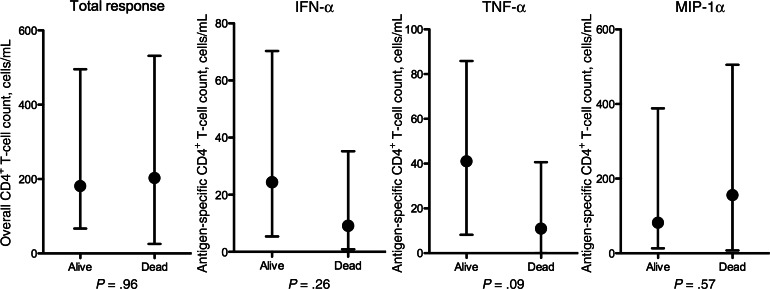
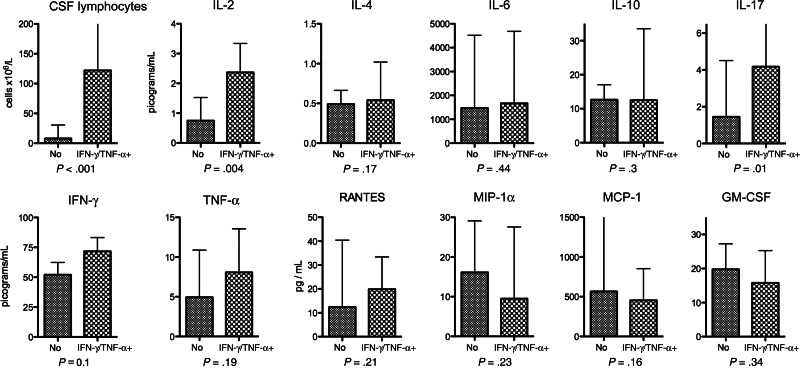
Results: Cryptococcal-specific CD4(+) T-cell responses were characterized by the production of macrophage inflammatory protein 1α, interferon γ (IFN-γ), and tumor necrosis factor α (TNF-α). Conversely, minimal interleukin 4 and interleukin 17 production was detected. Patients surviving to 2 weeks had significantly different functional CD4(+) T-cell responses as compared to those who died. Patients with a response predominantly consisting of IFN-γ or TNF-α production had a 2-week mortality of 0% (0/20), compared with 25% (6/24) in those without this response (P = .025). Such patients also had lower fungal burdens (10 400 vs 390 000 colony-forming units/mL; P < .001), higher cerebrospinal fluid lymphocyte counts (122 vs 8 cells/μL; P < .001), and a trend toward faster rates of clearance of infection.

Conclusions: The phenotype of the peripheral CD4(+) T-cell response to Cryptococcus was associated with disease severity and outcome in HIV-associated cryptococcal meningitis. IFN-γ/TNF-α-predominant responses were associated with survival.

Keywords: CMV; HIV; TB; cryptococcus neoformans; flow cytometry; memory T cells.


Figures

Figure 1.
Figure 1.
A, Analytic gating of the flow cytometry data. a, Singlet cells were sorted from aggregates on the basis of forward-scatter height (FSC-H) and forward-scatter area (FSC-A). b, Dead cells, B-cells, and monocytes were excluded by staining with live/dead violet viability/vitality dye staining and CD14 and CD19 staining. c, The small lymphocyte population was selected. d, CD3+ cells were selected. CD3+CD8 cells (e) and then CD3+CD4+ cells (f) were sequentially selected. g, The memory T-cell population was defined as CD3+CD8CD4+ cells that were not CD27+CD45RO. h, Cytokine gating for interferon γ (IFN-γ), interleukin 2 (IL-2), interleukin 4 (IL-4), interleukin 17 (IL-17), macrophage inflammatory protein 1α (MIP-1α) and tumor necrosis factor α (TNF-α) was done on the memory cell population. B, Analytic gating of the flow cytometry data is shown. Cytokine gating for IFN-γ, IL-2, IL-4, IL-17, MIP-1α, and TNF-α was done on the memory cell population.
Figure
2.
Figure 2.
A, The magnitude of cryptococcal antigen (CRAG)–, cytomegalovirus (CMV)–, and Mycobacterium tuberculosis–specific CD4+ T-cell responses in patients with HIV-associated cryptococcal meningitis. The frequency of CRAG-, CMV-, and M. tuberculosis–specific CD4+ memory T-cell responses in patients with a detectable antigen-specific response at baseline is shown. The frequency of cytokine-producing cells in each individual is shown as a percentage of their total memory CD4+ T-cell population. Wide bars represent the median percentage, with error bars showing the interquartile range. A detectable total CD4+ T-cell response was defined as at least 0.1% of cells cytokine positive after subtraction of background, with at least 10 cytokine-positive events over background. Statistical comparison between groups was performed using the Kruskal-Wallis test. In the 4 patients with large magnitude CMV responses, 10%, 18%, 23%, and 85% of CD4+ memory T cells were CMV specific. In the 2 patients with large-magnitude M. tuberculosis responses, 6% and 7% of CD4+ memory T cells were M. tuberculosis specific. B, Differences in cytokine production in response to CRAG, CMV, and M. tuberculosis. The proportion of CRAG-, CMV-, and M. tuberculosis–specific CD4+ memory T cells producing interferon γ (IFN-γ), interleukin 2 (IL-2), interleukin 4 (IL-4), interleukin 17 (IL-17), macrophage inflammatory protein 1α (MIP-1α), and tumor necrosis factor α (TNF-α; as determined by flow cytometry after background subtraction) in patients with a detectable antigen specific response is shown. Bars are to the median, with error bars to the 75th percentile. The proportion of IFN-γ–producing cells was highest in the CMV-specific responses, while M. tuberculosis–specific responses had the highest proportions of IL-2 and TNF-α production, and MIP-1α production was highest in CRAG-specific responses.
Figure
3.
Figure 3.
The functional phenotype of cryptococcal antigen (CRAG)–, cytomegalovirus (CMV)–, and Mycobacterium tuberculosis–specific CD4+ memory T-cell responses at baseline. Peripheral blood mononuclear cells from human immunodeficiency virus–positive subjects with cryptococcal meningitis were stimulated with cryptococcal mannoprotein, CMV pp65, or M. tuberculosis ESAT-6, CFP-10, and PPD. Flow cytometry of interferon γ (IFN-γ), interleukin 2 (IL-2), macrophage inflammatory protein 1α (MIP-1α), and tumor necrosis factor α (TNF-α) production within pathogen-specific CD4+ memory T cells is shown. The bar chart shows each of the 15 possible response profiles on the x-axis. The percentage of the total cytokine response is shown on the y-axis, with the filled bar representing the interquartile range and a line at the median. CRAG-specific responses are shown in blue, CMV-specific responses are in red, and M. tuberculosis–specific responses are in green. Statistically significant differences (P < .05) by rank-sum testing are indicated by the pound sign. The pie charts show the fractions according to the pie-slice colors shown at the bottom of the bar chart, with color-coded circles indicating the contributions of IFN-γ (red), IL-2 (yellow), MIP-1α (green), and TNF-α (blue) to the 4-, 3-, 2-, and 1-function responses. Statistical comparisons of the overall responses by permutation testing are shown in the pie category test result chart.
Figure
4.
Figure 4.
Differences in functional phenotype of the cryptococcal antigen (CRAG)–specific responses at baseline between subjects who survived and subjects who died. Results of flow cytometry of interferon γ (IFN-γ), interleukin 2 (IL-2), macrophage inflammatory protein 1α (MIP-1α), and tumor necrosis factor α (TNF-α) production within CRAG-specific CD4+ memory T cells at baseline for patients who survived to 2 weeks and those who died are shown. The bar chart shows each of the 15 possible response profiles on the x-axis. The percentage of the total cytokine response is shown on the y-axis, with the filled bar representing the interquartile range and a line at the median. CRAG-specific responses in survivors are shown in blue, and response for those who died are in red. Statistically significant differences (P < .05) on rank-sum testing are indicated by the pound sign. The pie charts show the fractions according to the pie-slice colors shown at the bottom of the bar chart, with color-coded circles indicating the contributions of IFN-γ (red), IL-2 (yellow), MIP-1α (green), and TNF-α (blue) to the 4-, 3-, 2-, and 1-function responses. Statistical comparisons of the overall responses in those who survived versus those who died by permutation testing are shown in the pie category test result chart.
Figure
5.
Figure 5.
The absolute cryptococcal antigen (CRAG)–specific cytokine–producing, interferon γ (IFN-γ)–producing, tumor necrosis factor α (TNF-α)–producing and macrophage inflammatory protein 1α (MIP-1α)–producing CD4+ T-cell counts at baseline in subjects who survived and subjects who died. Absolute numbers of antigen-specific CD4+ T cells were calculated by multiplying the proportion of cytokine-positive CD4+ T cells by the total CD4+ T-cell count. Responses are shown according to 2-week mortality outcome. Statistical comparisons were made using the Mann–Whitney U test.
Figure 6.
Figure 6.
Cerebrospinal fluid (CSF) immune parameters in subjects with and subjects without an interferon γ (IFN-γ)/tumor necrosis factor α (TNF-α)–predominant cryptococcal antigen (CRAG)–specific CD4+ T-cell response. CSF cytokine concentrations in patients with a detectable CRAG-specific CD4+ memory T-cell response are shown, divided into patients with an IFN-γ/TNF-α–predominant response or a macrophage inflammatory protein 1α (MIP-1α)–predominant response. A detectable total CD4+ T-cell response was defined as at least 0.1% of cells cytokine positive after subtraction of background, with at least 10 cytokine-positive events over background. A MIP-1α–predominant response was defined as >50% of CRAG-specific cells producing MIP-1α, and a IFN-γ/TNF-α–predominant response was defined as <50% CRAG-specific cells producing MIP-1α. Statistical comparisons were made using the Mann–Whitney U test. Abbreviations: GM-CSF, granulocyte-macrophage colony-stimulating factor; MCP-1, monocyte chemotactic protein 1.

Comment in

References

    1. Park BJ, Wannemuehler KA, Marston BJ, Govender N, Pappas PG, Chiller TM. Estimation of the current global burden of cryptococcal meningitis among persons living with HIV/AIDS. AIDS. 2009;23:525–30. - PubMed
    1. Casadevall A, Steenbergen JN, Nosanchuk JD. ‘Ready made’ virulence and ‘dual use’ virulence factors in pathogenic environmental fungi—the Cryptococcus neoformans paradigm. Curr Opin Microbiol. 2003;6:332–7. - PubMed
    1. Huffnagle GB, Yates JL, Lipscomb MF. Immunity to a pulmonary Cryptococcus neoformans infection requires both CD4+ and CD8+ T cells. J Exp Med. 1991;173:793–800. - PMC - PubMed
    1. Huffnagle GB, Lipscomb MF, Lovchik JA, Hoag KA, Street NE. The role of CD4+ and CD8+ T cells in the protective inflammatory response to a pulmonary cryptococcal infection. J Leukoc Biol. 1994;55:35–42. - PubMed
    1. Hill JO, Aguirre KM. CD4+ T cell-dependent acquired state of immunity that protects the brain against Cryptococcus neoformans. J Immunol. 1994;152:2344–50. - PubMed

Publication types

MeSH terms