. 2013 Jun;50(3):777-801.
doi: 10.1007/s13524-012-0193-x.

Bayesian probabilistic projections of life expectancy for all countries

Affiliations

Bayesian probabilistic projections of life expectancy for all countries

Adrian E Raftery et al. Demography. 2013 Jun.

Abstract

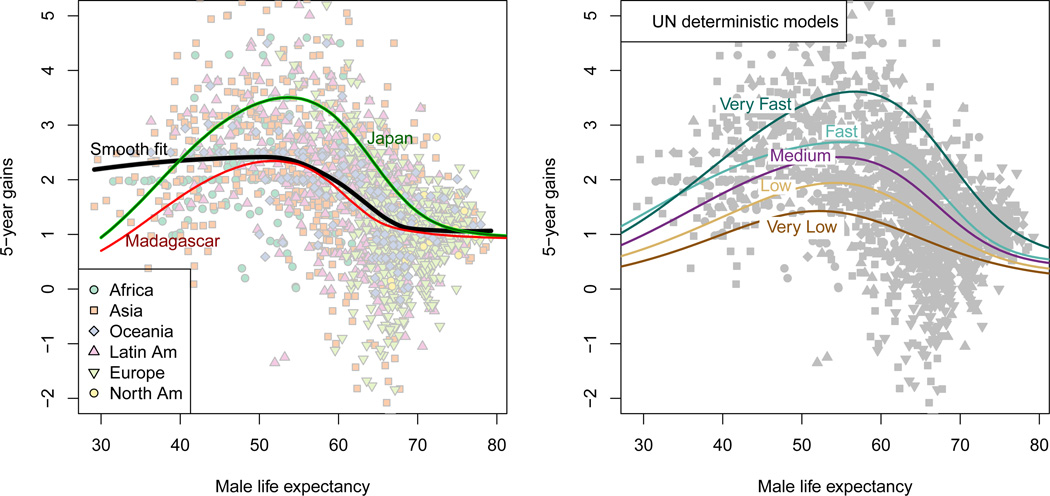
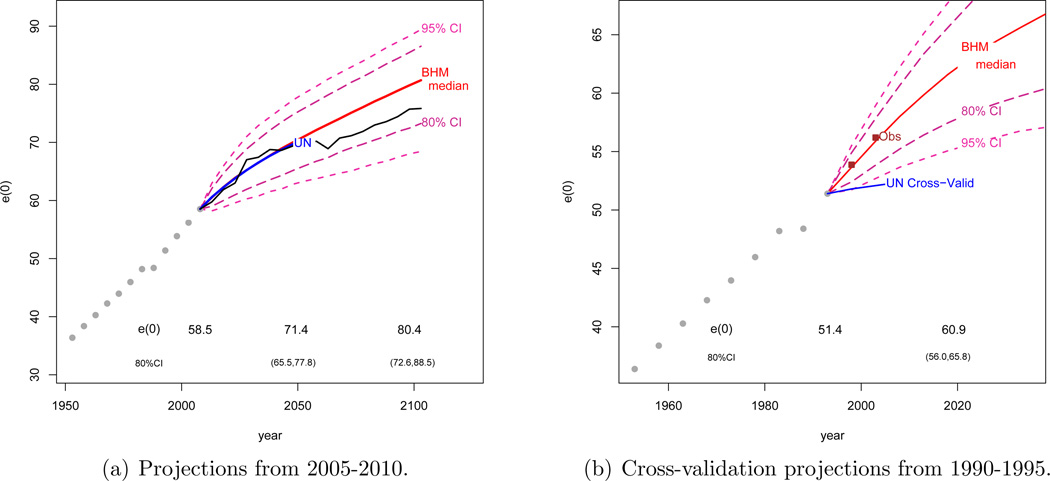
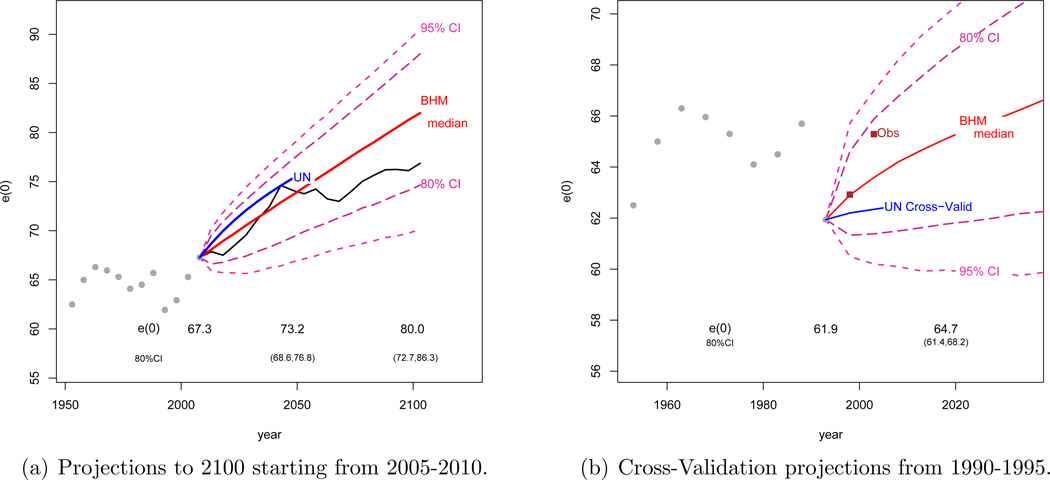
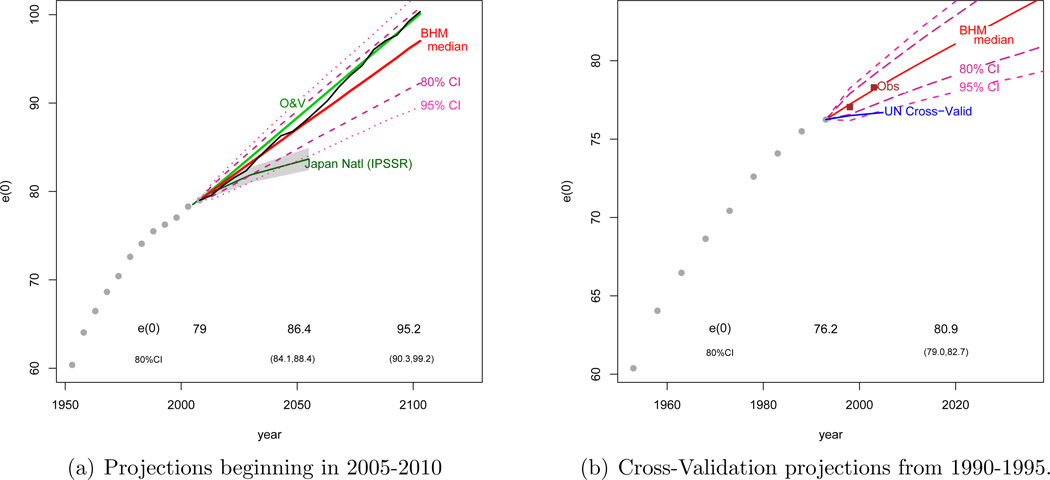
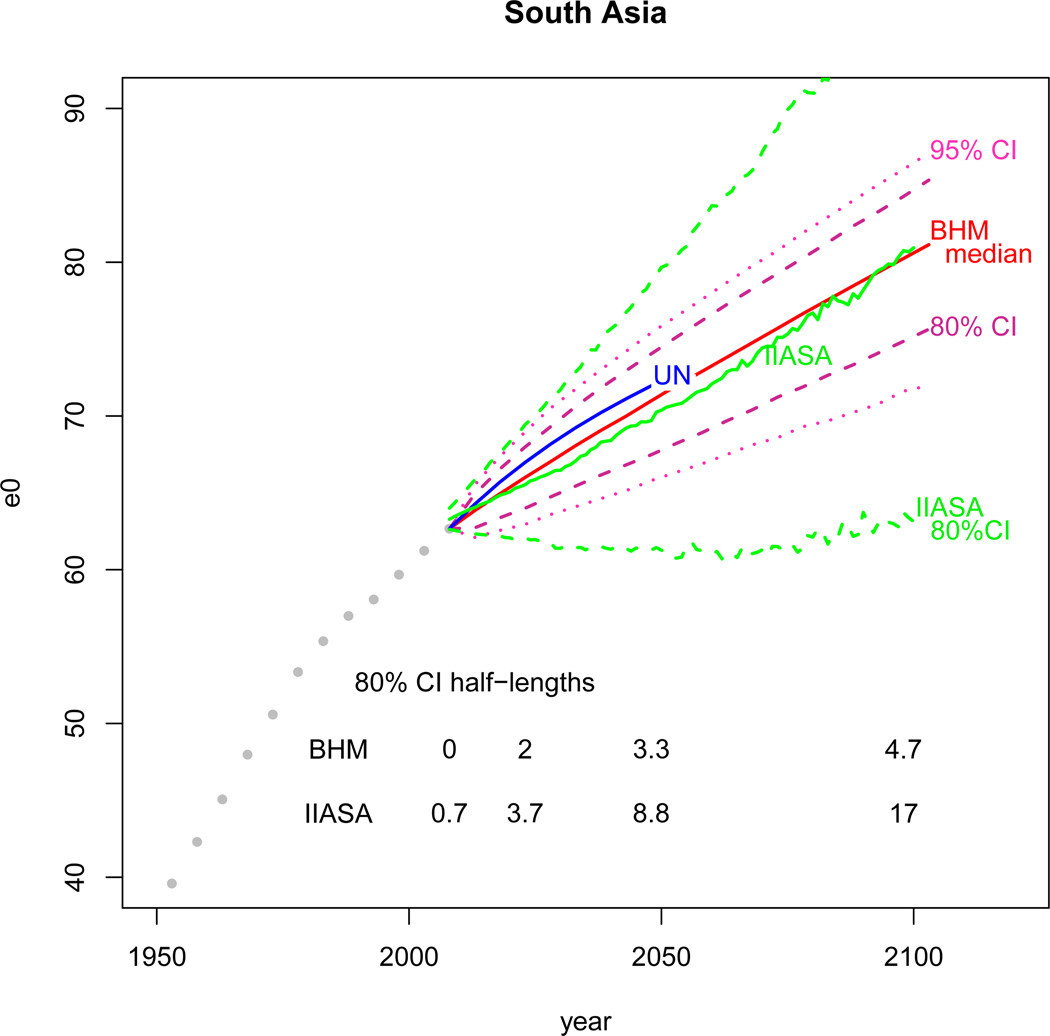
We propose a Bayesian hierarchical model for producing probabilistic forecasts of male period life expectancy at birth for all the countries of the world to 2100. Such forecasts would be an input to the production of probabilistic population projections for all countries, which is currently being considered by the United Nations. To evaluate the method, we conducted an out-of-sample cross-validation experiment, fitting the model to the data from 1950-1995 and using the estimated model to forecast for the subsequent 10 years. The 10-year predictions had a mean absolute error of about 1 year, about 40 % less than the current UN methodology. The probabilistic forecasts were calibrated in the sense that, for example, the 80 % prediction intervals contained the truth about 80 % of the time. We illustrate our method with results from Madagascar (a typical country with steadily improving life expectancy), Latvia (a country that has had a mortality crisis), and Japan (a leading country). We also show aggregated results for South Asia, a region with eight countries. Free, publicly available R software packages called bayesLife and bayesDem are available to implement the method.


Figures

Figure 1
Figure 1
Observed five-year gains in life expectancy, plotted against the life expectancy at the beginning of the five-year period. UN estimates for 158 countries from 1950 to 2005 are included in this figure (n = 1, 738). Each point represents an observed five-year gain in life expectancy within a country. The black line is a locally-weighted polynomial (lowess) regression of the observations, which highlights the non-constant rate of gains in life expectancy. Included in the left plot are the fitted posterior median double-logistic functions for Japan and Madagascar from our model. The UN deterministic models are included in the right plot. (Note: 31 observations (1.8%) are outside the range of the plot and not shown, but were included in the local regression.)
Figure 2
Figure 2
Illustration of the double-logistic function, based on a curve from the posterior distribution for Japan. The left plot illustrates the double-logistic function of 5-year gains in life expectancy. The right plot is a time-series of life expectancy with gains modeled according to the double-logistic function.
Figure 3
Figure 3
Absolute residuals from the constant variance model plotted against across life expectancy, with fitted regression spline. (Note: 44 (2.8%) of the residuals are outside the range of the plot, but were included in the regression spline fit.)
Figure 4
Figure 4
Life Expectancy Projections for Males in Madagascar. The above plots include the UN projections and our median projections, with 80% and 95% prediction intervals. The life expectancy values used to estimate our model are indicated by grey circles. (a) Projections from 2005–2010. A typical stochastic trajectory is shown in black, illustrating that the future trajectory is likely to be less smooth than the median projection. (b) Cross-validation projections from 1990–1995. Observed life expectancies from 1995–2005 are shown as squares.
Figure 5
Figure 5
Life Expectancy Projections for Latvia. The above plots include the UN projections and BHM median projections, with 80% and 95% prediction intervals. The past values of life expectancy values used to estimate our model are shown by grey circles. (a) Projections to 2100 starting from 2005–2010. A typical stochastic trajectory is shown in black, illustrating the non-smoothness of individual projections. (b) Out-of-sample projections starting from 1990–1995. Observed life expectancies from 1995–2005 are shown as squares. By 1995, Latvia had not yet recovered from its mortality crisis; the BHM projection intervals reflect uncertainty about a full recovery.
Figure 6
Figure 6
Life Expectancy Projections for Japan. The above plots include the UN projections and BHM median projections, with 80% and 95% prediction intervals. The life expectancy values used to estimate our model are show by grey circles. (a) Projections from 2005–2010 with a sample trajectory. National Institute of Population and Social Security Research (IPSS) medium variant projections are the same as the UN projections with uncertainty bounds indicated in the shaded region. We include a trajectory with a constant increase of 1.11 years per five-year period, as estimated by Oeppen and Vauppel (O & V) (2002) for the “best practices” country. A typical stochastic trajectory is shown in black. (b) Cross-validation projections from 1990–1995. Observed life expectancies from 1995–2005 are shown as squares.
Figure 7
Figure 7
Life expectancy projections for South Asia (IIASA-defined) for our BHM model, IIASA and the UN. The median projections for BHM and IIASA are similar, but the IIASA 80% intervals are much wider than the BHM 80% interval.

References

    1. Alho J. Aggregation across countries in stochastic population forecasts. International Journal of Forecasting. 2008;24:343–353.
    1. Alho JM. Statistical Demography and Forecasting. New York: Springer; 2005.
    1. Alkema L, Raftery AE, Gerland P, Clark SJ, Pelletier F. Assessing uncertainty in fertility estimates and projections. Paper presented at the 2008 Annual Meeting of the Population Association of America; New Orleans, La., USA. 2008. http://paa2008.princeton.edu/abstractViewer.aspx?submissionId=80115.
    1. Alkema L, Raftery AE, Gerland P, Clark SJ, Pelletier F, Buettner T, Heilig G. Probabilistic projections of the total fertility rate for all countries. Demography. 2011;48:815–839. - PMC - PubMed
    1. Bell W. Comparing and assessing time series methods for forecasting age-specific fertility and mortality rates. Journal of Official Statistics. 1997;13:279–202.

Publication types

LinkOut - more resources