Comparative Study
. 2013 Dec;26(6):1091-8.
doi: 10.1007/s10278-013-9593-8.

Quantitative ultrasound analysis for classification of BI-RADS category 3 breast masses

Affiliations
Comparative Study

Quantitative ultrasound analysis for classification of BI-RADS category 3 breast masses

Woo Kyung Moon et al. J Digit Imaging. 2013 Dec.

Abstract

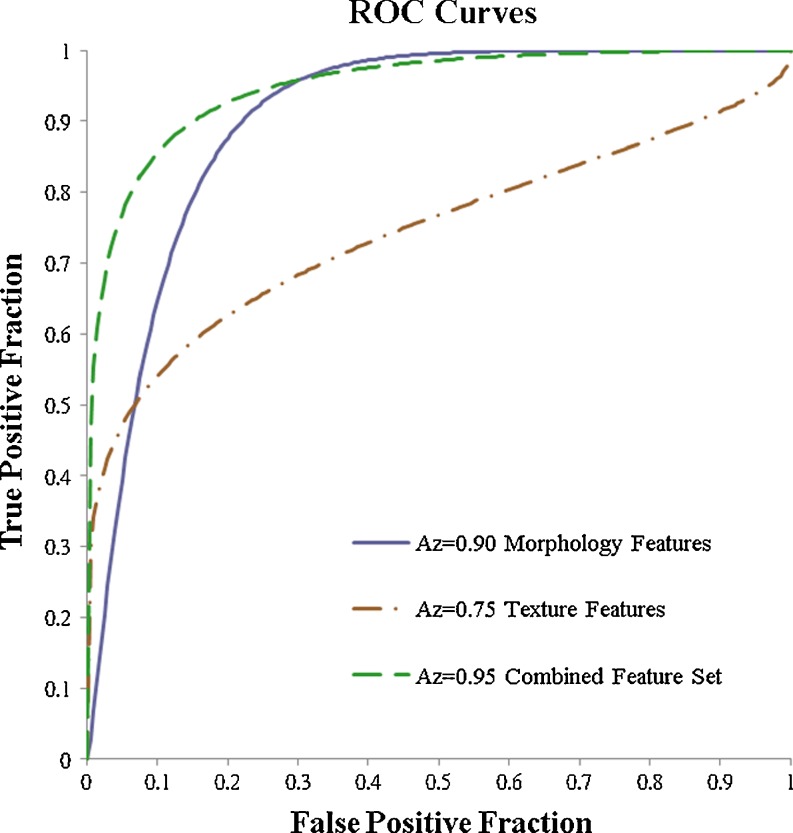
The accuracy of an ultrasound (US) computer-aided diagnosis (CAD) system was evaluated for the classification of BI-RADS category 3, probably benign masses. The US database used in this study contained 69 breast masses (21 malignant and 48 benign masses) that at blinded retrospective interpretation were assigned to BI-RADS category 3 by at least one of five radiologists. For computer-aided analysis, multiple morphology (shape, orientation, margin, lesions boundary, and posterior acoustic features) and texture (echo patterns) features based on BI-RADS lexicon were implemented, and the binary logistic regression model was used for classification. The receiver operating characteristic curve analysis was used for statistical analysis. The area under the curve (Az) of morphology, texture, and combined features were 0.90, 0.75, and 0.95, respectively. The combined features achieved the best performance and were significantly better than using texture features only (0.95 vs. 0.75, p value = 0.0163). The cut-off point at the sensitivity of 86 % (18/21), 95 % (20/21), and 100 % (21/21) achieved the specificity of 90 % (43/48), 73 % (35/48), and 33 % (16/48), respectively. In conclusion, the proposed CAD system has the potential to be used in upgrading malignant masses misclassified as BI-RADS category 3 on US by the radiologists.


Figures

Fig. 1
Fig. 1
The illustration of the quantitative features for describing BI-RADS US lexicon. a The original US image of a BI-RADS category 3 mass confirmed as benign fibroadenoma at core needle biopsy. b The segmentation result of (a). c Tumor perimeter (Tumor_p) was compared to the length of the major axis of the best-fit ellipse (Ellipse_a) to quantify the shape features. d The angle between the major axis of the best-fit ellipse and the horizontal line (Ellipse_theta) was used to quantify the orientation feature. e The undulations on tumor boundary (MU, MNS) were used to quantify the margin features. f The gray-level intensity difference between the inner and outer bands around the tumor boundary (LB) was used to quantify the boundary feature. g The gray-level intensity difference between the region under the tumor and the tumor (PS) was used to quantify the posterior acoustic feature. h The spatial correlations between pixels inside a tumor (16 GLCM texture features) were used to quantify the echo pattern features
Fig. 2
Fig. 2
The receive operating characteristic (ROC) curves of the morphology features, the texture feature, and the combined feature set
Fig. 3
Fig. 3
The performances of the top eight features evaluated by using accuracy, Pearson correlation, and t test. The first four features (Ellipse_a/b, Ellipse_theta, Ep/Tp, and Ellipse_b) achieved better accuracy and Pearson correlation value than the last four. Ellipse_a/b, Ellipse_theta, Ep/Tp, and Ellipse_b were extracted from the best-fit ellipse. Tumor_p was the tumor perimeter. EPc was the contrast value of tumor. NRL_entropy was the regularity measurement of tumor boundary. Undulation described tumor margin
Fig. 4
Fig. 4
One malignant lesion (invasive ductal carcinoma) classified correctly by the proposed CAD system. a The original US image. b The segmentation result of (a). c The corresponding best-fit ellipse compared to the segmentation result of (b)
Fig. 5
Fig. 5
One benign lesion (fibrocystic changes) classified correctly by the proposed CAD system. a The original US image. b The segmentation result of (a). c The corresponding best-fit ellipse compared to the segmentation result of (b)

References

    1. Stavros AT, Thickman D, Rapp CL, Dennis MA, Parker SH, Sisney GA. Solid breast nodules: use of sonography to distinguish between benign and malignant lesions. Radiology. 1995;196:123–134. - PubMed
    1. American College of Radiology, editor. Breast Imaging Reporting and Data System. 4. Reston: American College of Radiology; 2003. - PMC - PubMed
    1. Berg WA. Supplemental screening sonography in dense breasts. Radiol Clin North Am. 2004;42:845–851. doi: 10.1016/j.rcl.2004.04.003. - DOI - PubMed
    1. Sickles EA. Nonpalpable, circumscribed, noncalcified solid breast masses—likelihood of malignancy based on lesion size and age of patient. Radiology. 1994;192:439–442. - PubMed
    1. Leung JW, Sickles EA. The probably benign assessment. Radiol Clin North Am. 2007;45:773–789. doi: 10.1016/j.rcl.2007.06.008. - DOI - PubMed

Publication types

MeSH terms