

Sources of technical variability in quantitative LC-MS proteomics: human brain tissue sample analysis
- PMID: 23495885
- PMCID: PMC3695475
- DOI: 10.1021/pr301146m
Sources of technical variability in quantitative LC-MS proteomics: human brain tissue sample analysis
Abstract
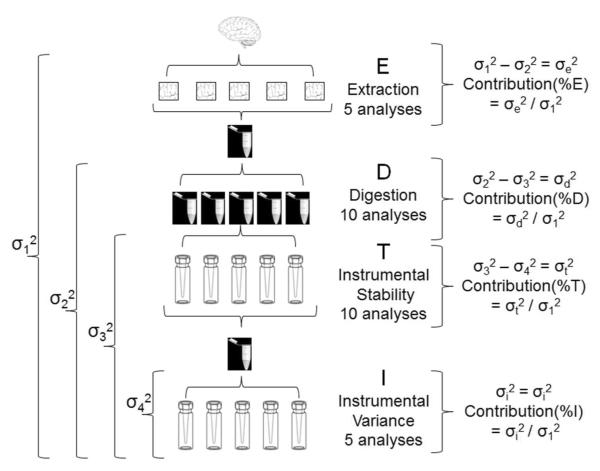
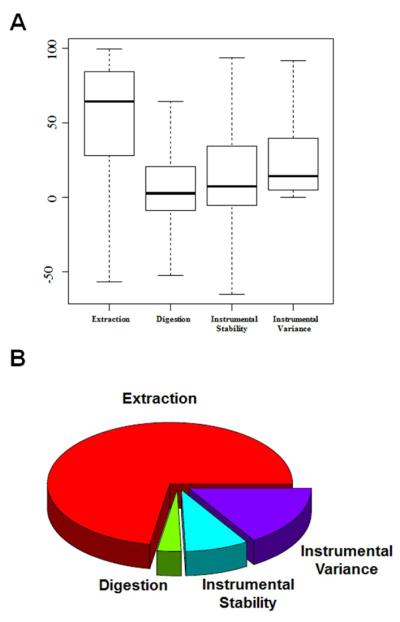
To design a robust quantitative proteomics study, an understanding of both the inherent heterogeneity of the biological samples being studied as well as the technical variability of the proteomics methods and platform is needed. Additionally, accurately identifying the technical steps associated with the largest variability would provide valuable information for the improvement and design of future processing pipelines. We present an experimental strategy that allows for a detailed examination of the variability of the quantitative LC-MS proteomics measurements. By replicating analyses at different stages of processing, various technical components can be estimated and their individual contribution to technical variability can be dissected. This design can be easily adapted to other quantitative proteomics pipelines. Herein, we applied this methodology to our label-free workflow for the processing of human brain tissue. For this application, the pipeline was divided into four critical components: Tissue dissection and homogenization (extraction), protein denaturation followed by trypsin digestion and SPE cleanup (digestion), short-term run-to-run instrumental response fluctuation (instrumental variance), and long-term drift of the quantitative response of the LC-MS/MS platform over the 2 week period of continuous analysis (instrumental stability). From this analysis, we found the following contributions to variability: extraction (72%) >> instrumental variance (16%) > instrumental stability (8.4%) > digestion (3.1%). Furthermore, the stability of the platform and its suitability for discovery proteomics studies is demonstrated.
Figures


References
-
- Aebersold R, Mann M. Mass spectrometry-based proteomics. Nature. 2003;422:198–207. - PubMed
-
- Ferguson PL, Smith RD. Proteome analysis by mass spectrometry. Annu. Rev. Biophys. Biomolec. Struct. 2003;32:399–424. - PubMed
-
- Cravatt BF, Simon GM, Yates JR. The biological impact of mass-spectrometry-based proteomics. Nature. 2007;450:991–1000. - PubMed
Publication types
MeSH terms
Substances
Grants and funding
LinkOut - more resources
Full Text Sources
Other Literature Sources
