Correction of unexpected distributions of P values from analysis of whole genome arrays by rectifying violation of statistical assumptions
- PMID: 23496791
- PMCID: PMC3610227
- DOI: 10.1186/1471-2164-14-161
Correction of unexpected distributions of P values from analysis of whole genome arrays by rectifying violation of statistical assumptions
Abstract
Background: Statistical analysis of genome-wide microarrays can result in many thousands of identical statistical tests being performed as each probe is tested for an association with a phenotype of interest. If there were no association between any of the probes and the phenotype, the distribution of P values obtained from statistical tests would resemble a Uniform distribution. If a selection of probes were significantly associated with the phenotype we would expect to observe P values for these probes of less than the designated significance level, alpha, resulting in more P values of less than alpha than expected by chance.
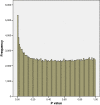
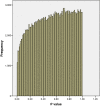
Results: In data from a whole genome methylation promoter array we unexpectedly observed P value distributions where there were fewer P values less than alpha than would be expected by chance. Our data suggest that a possible reason for this is a violation of the statistical assumptions required for these tests arising from heteroskedasticity. A simple but statistically sound remedy (a heteroskedasticity-consistent covariance matrix estimator to calculate standard errors of regression coefficients that are robust to heteroskedasticity) rectified this violation and resulted in meaningful P value distributions.
Conclusions: The statistical analysis of 'omics data requires careful handling, especially in the choice of statistical test. To obtain meaningful results it is essential that the assumptions behind these tests are carefully examined and any violations rectified where possible, or a more appropriate statistical test chosen.
Figures


References
-
- Benjamini Y, Hochberg Y. Controlling the false discovery rate: a practical and powerful approach to multiple testing. J R Stat Soc Ser B. 1995;57(1):289–300.
-
- Core Team R. R: A Language and Environment for Statistical Computing. 2012.
-
- Huang S, Podsypanina K, Chen Y, Cai W, Tsimelzon A, Hilsenbeck S, Li Y. Wnt-1 is dominant over neu in specifying mammary tumor expression profiles. Technol Cancer Res Treat. 2006;5:565–571. - PubMed
Publication types
MeSH terms
Grants and funding
LinkOut - more resources
Full Text Sources
Other Literature Sources

